
By Dr. Pellumb Kabashi, DBA, MBA, CES, CFE, EA
Founder, Tax Expert Today LLC · Tax advisors, enrolled agents, CPAs, and attorneys · Serving clients in all 50 states
Quick Answer: IRS liens and levies statistics for fiscal year 2025 show 214,099 notices of federal tax lien filed, 339,137 notices of levy on third parties, and just 50 seizures of property, the fewest seizures in the twelve years studied. Liens and levies have risen for three straight years from their 2022 low, yet they remain 60 and 83 percent below fiscal year 2014. Call (239) 441-2005 for a free consultation.
Tax Expert Today Research · Report 2026-05
The IRS Enforcement Report, Fiscal Years 2014 to 2025. An original analysis of eleven consecutive editions of the IRS Data Book table on delinquent collection activities, read side by side to build a twelve year series of federal tax liens, levies, and seizures against the size of the delinquent account inventory. Every figure was computed from the IRS source files, cross checked across overlapping editions, and reconciled to the printed Data Book and to TIGTA. This report is updated annually when the IRS releases a new Data Book. Download the PDF edition or browse all TET Research reports.
Liens, levies, and seizures are the three tools the IRS uses when a tax debt goes unpaid after the notices stop working. A lien is a public claim against everything the taxpayer owns. A levy takes the money itself, from a bank account, a paycheck, or a receivable. A seizure takes physical property, most often real estate, for sale. The IRS reports how often it uses each tool once a year, in a single table of its Data Book, and each edition covers only two fiscal years. Tax Expert Today read eleven editions of that table, published from 2015 through 2025, and joined them into one twelve year series. The result is the clearest available picture of how IRS collection enforcement has changed: far fewer actions than a decade ago, a modest recovery since 2022, and a balance owed on delinquent accounts that has never been larger. For what each notice in the sequence means, our guide to IRS Letter 1058 and LT11 explains the final notice that comes before a levy.
What Do IRS Liens and Levies Statistics Show for 2025?
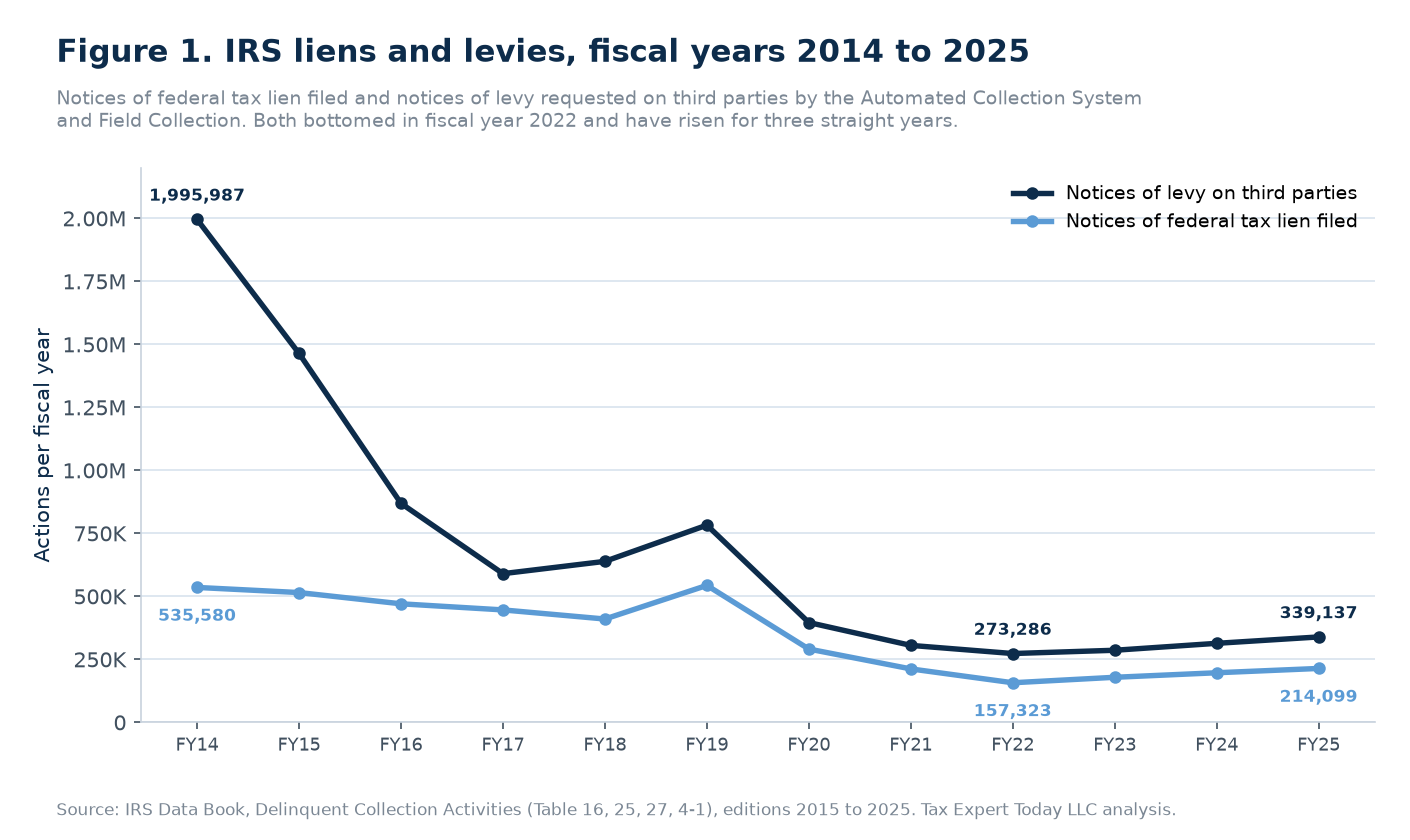
In fiscal year 2025 the IRS filed 214,099 notices of federal tax lien, requested 339,137 levies on third parties, and conducted 50 seizures. Liens rose 8.7 percent and levies 8.1 percent from 2024, the third straight annual increase for both, while seizures fell 29.6 percent to the lowest count in the twelve years studied.
- The rebound is real but small. Liens are up 36.1 percent and levies 24.1 percent from their fiscal year 2022 low, which still leaves both far below where they stood before the pandemic.
- The long decline dominates. Against fiscal year 2014, liens are down 60.0 percent, levies 83.0 percent, and seizures 88.4 percent.
- Seizures moved the other way. While liens and levies climbed in 2025, seizures fell from 71 to 50, about one for each state.
- The debt kept growing. The balance owed on delinquent accounts in inventory reached $211.5 billion, up 61.9 percent from fiscal year 2014 in current dollars.
The three counts measure different things, and the Data Book footnotes define each one precisely. The lien count is the number of lien requests entered into the IRS Automated Lien System. The levy count is the number of levies requested on third parties, such as banks and employers, by the Automated Collection System and the Field Collection program. The seizure count is the number of seizures conducted by Field Collection, the revenue officers who work the largest and most complex cases in person. None of the three counts unique taxpayers. A single taxpayer can receive several liens in different counties, and several levies on different accounts, in the same year.
| Fiscal year | Liens filed | Levies on third parties | Seizures | Delinquent accounts at year end | Balance owed (billions) |
|---|---|---|---|---|---|
| 2014 | 535,580 | 1,995,987 | 432 | 12,410,000 | $130.6 |
| 2015 | 515,247 | 1,464,026 | 426 | 13,371,000 | $137.3 |
| 2016 | 470,602 | 869,196 | 436 | 14,005,464 | $138.2 |
| 2017 | 446,378 | 590,249 | 323 | 14,080,000 | $131.1 |
| 2018 | 410,220 | 639,025 | 275 | 13,185,584 | $128.2 |
| 2019 | 543,604 | 782,735 | 228 | 11,230,082 | $125.8 |
| 2020 | 291,081 | 396,269 | 77 | 8,426,950 | $114.3 |
| 2021 | 212,251 | 305,610 | 96 | 10,278,326 | $133.4 |
| 2022 | 157,323 | 273,286 | 89 | 9,379,515 | $120.2 |
| 2023 | 179,019 | 286,270 | 68 | 11,375,720 | $158.6 |
| 2024 | 196,996 | 313,792 | 71 | 14,901,508 | $208.4 |
| 2025 | 214,099 | 339,137 | 50 | 13,112,485 | $211.5 |
Source: IRS Data Book, Delinquent Collection Activities (Table 16 in the 2015 to 2018 editions, Table 25 in 2019 to 2022, Table 27 in 2023 and 2024, Table 4-1 in 2025). Each year is taken from the latest edition that holds it. Editions before 2019 report delinquent account counts in thousands, so the counts for 2014, 2015, and 2017 are rounded to the nearest thousand. Balances are in current dollars.
How Many Federal Tax Liens Does the IRS File Each Year?
The IRS filed 214,099 notices of federal tax lien in fiscal year 2025, up from 196,996 in 2024 and from a low of 157,323 in 2022. That is 60.0 percent below fiscal year 2014 and 80.5 percent below the 1,096,376 filings in fiscal year 2010, which TIGTA identifies as the peak.
A federal tax lien arises automatically under section 6321 once a tax is assessed, the IRS sends a demand for payment, and the taxpayer does not pay. The lien exists whether or not anything is filed. What the Data Book counts is the notice of federal tax lien, the public filing in a county or state office that tells creditors, lenders, and buyers that the government has a claim. The notice is what damages credit, complicates a refinance, and clouds title on a sale, which is why it matters far more to most taxpayers than the underlying statutory lien.
- The decline began long before the pandemic. Filings fell every year from 2014 to 2018, from 535,580 to 410,220, before a one year rise to 543,604 in 2019.
- The pandemic pause cut filings almost in half. Fiscal year 2020 recorded 291,081 notices, and filings kept falling to 157,323 in 2022.
- The recovery has been gradual. Three annual increases have added 56,776 notices to the 2022 low, but 2025 filings are still 60.6 percent below 2019.
- Staffing tracks the trend. TIGTA reported in 2024 that the number of revenue officers fell almost 68 percent, from 5,922 at the end of fiscal year 2010 to 1,906 at the end of fiscal year 2022.
Lien filings also depend on the dollar threshold the IRS applies and on how many cases reach a revenue officer or the Automated Collection System at all, and neither is reported in the Data Book. For a taxpayer with a notice already on file, the practical questions are release and withdrawal. Our guide to IRS tax lien withdrawal with Form 12277 covers when the notice can be removed from the public record, and our guide to an IRS lien discharge covers selling a specific property while the lien remains in place.
How Many Levies Does the IRS Issue?
The IRS requested 339,137 levies on third parties in fiscal year 2025, up 8.1 percent from 2024 and 24.1 percent from the 2022 low of 273,286. In fiscal year 2014 the same count was 1,995,987, so levies issued through the Automated Collection System and Field Collection are down 83.0 percent in eleven years.
A levy is the legal seizure of property to satisfy a tax debt, authorized by section 6331. In practice most levies reach money held by someone else: a bank account, wages, accounts receivable, or a retirement account. The IRS must send a final notice of intent to levy, and under section 6330 a notice of the right to a Collection Due Process hearing, at least 30 days before the first levy for a tax period. The levy count in the Data Book is limited to levies requested on third parties by the Automated Collection System and Field Collection. It does not include the IRS’s automated levy programs, such as the Federal Payment Levy Program, which attach federal payments electronically without employee action.
The sharpest fall came early in the series. Levies dropped from 1,995,987 in 2014 to 590,249 in 2017, a decline of more than 1.4 million in three years, well before any pandemic relief. They recovered to 782,735 in 2019, fell to 396,269 in 2020, and have stayed between 273,286 and 339,137 every year since 2021. TIGTA’s July 2026 review of levies adds an important detail for reading the most recent years: the Automated Collection System resumed levy issuance on April 21, 2025, after a pause that began in March 2020, with only intermittent issuance between January 2021 and January 2022. TIGTA counted 4,860 systemic levies issued by the Automated Collection System to 4,768 taxpayers from April 21 through June 30, 2025.
Because the Data Book reports the Automated Collection System and Field Collection together, the table cannot show how much of the 2025 total came from the restart. Fiscal year 2026 will be the first full year with the Automated Collection System issuing levies again, and the 2026 edition is the place to test whether the restart moves the national count. If a levy has already reached an account, our guides to an IRS bank levy release and to how to stop an IRS wage garnishment explain the release grounds.
How Often Does the IRS Seize Property?
Rarely. The IRS conducted 50 seizures in fiscal year 2025, the fewest in the twelve years studied and 88.4 percent fewer than the 432 in fiscal year 2014. With 13,112,485 delinquent accounts in inventory at year end, that is one seizure for roughly every 262,250 delinquent accounts.
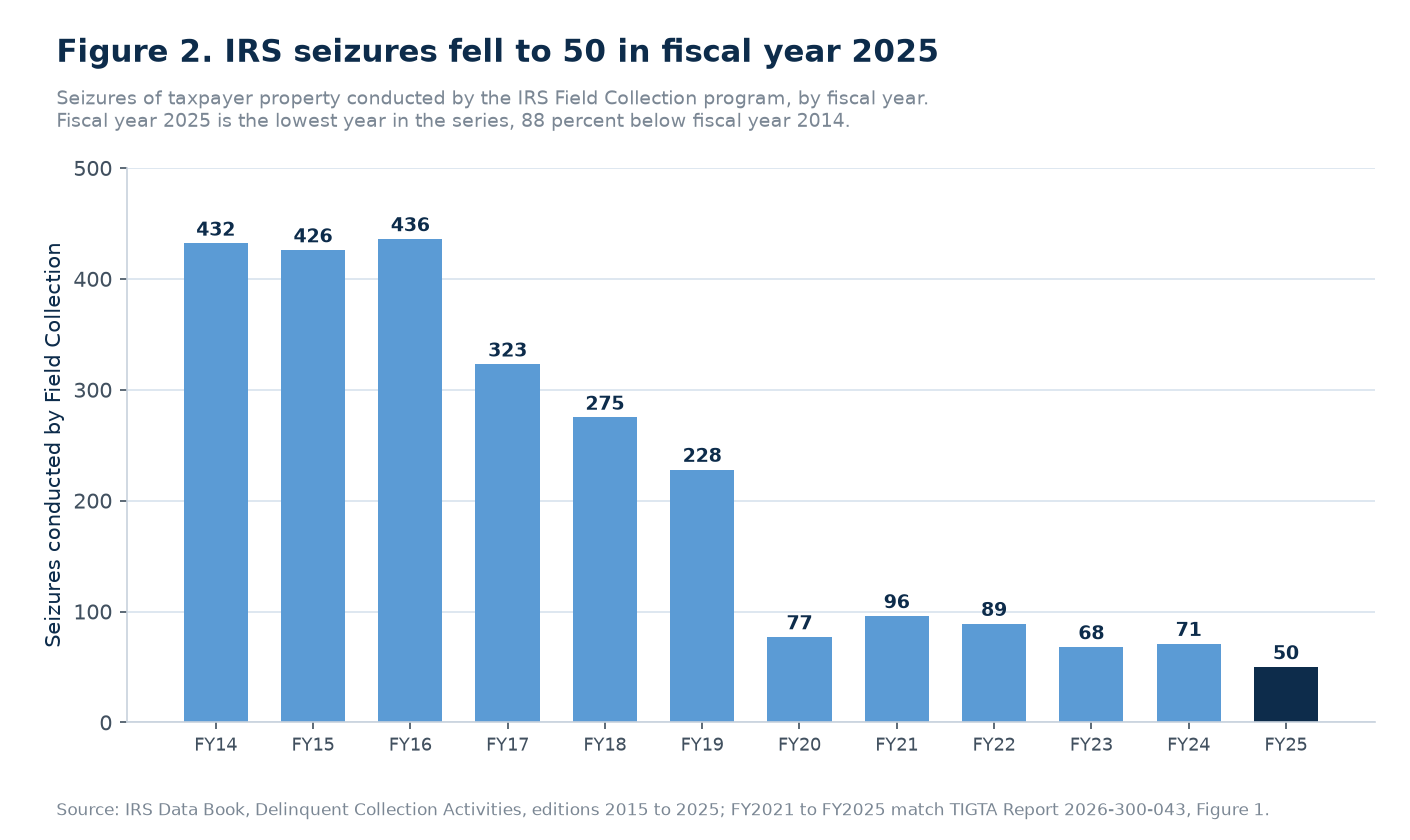
Seizure is the most intrusive collection action the IRS has, and the law surrounds it with conditions. Sections 6330 through 6344 govern notice, the hearing right, property that is exempt, the special approvals for a principal residence, and the sale. TIGTA must review IRS compliance with those provisions every year, and its reviews describe who is actually seized. For the twelve months from July 2024 through June 2025, TIGTA found 49 seizures involving 44 taxpayers, with balances due ranging from approximately $40,000 to over $25 million and an average of nearly $2.2 million. Most of the property taken was real estate.
- Seizures are aimed at large balances. TIGTA’s average balance of nearly $2.2 million is more than 130 times the $16,132 average balance per delinquent account in the Data Book inventory.
- Homes are seized only with extra safeguards. A principal residence requires court approval under section 6334(e), and TIGTA found eight properties in its latest review that were occupied by someone other than the taxpayer, such as tenants, as a principal residence.
- The five year average is 75. TIGTA reports 374 seizures across fiscal years 2021 to 2025, an average of 75 per year, which matches the Data Book series exactly.
For most taxpayers the seizure statistics are reassuring. Even a large balance is far more likely to end in a lien, a bank levy, or an installment agreement than in the sale of a house. Our explainer on whether the IRS can take your house sets out the legal hurdles in detail.
Is IRS Collection Enforcement Increasing?
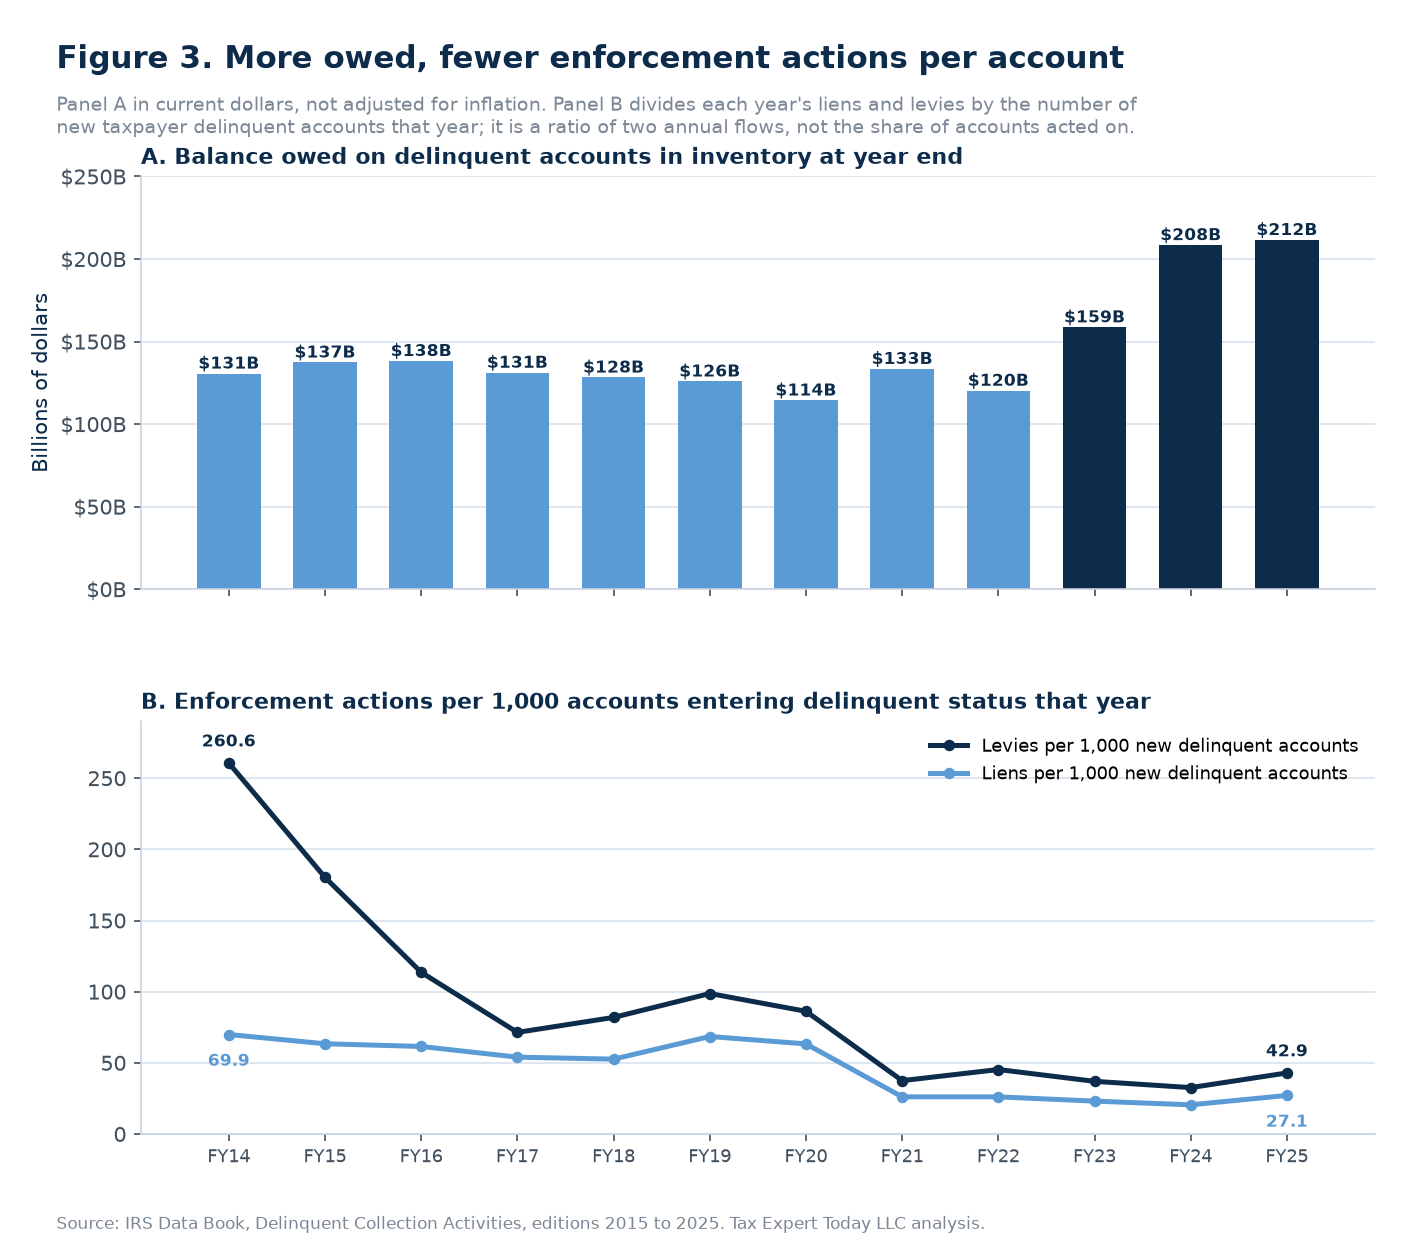
Liens and levies are increasing slowly, seizures are not. From the fiscal year 2022 low, liens rose 36.1 percent and levies 24.1 percent through 2025. Seizures fell over the same period, from 89 to 50. Measured against the delinquent account inventory, enforcement intensity remains far below its 2014 level.
Raw counts can mislead when the pool of delinquent accounts changes size, so this report also divides each year’s liens and levies by the number of new taxpayer delinquent accounts that entered collection that year. Both are annual flows reported in the same Data Book table. The result is not the share of accounts that received a lien or a levy, because a lien filed in 2025 can relate to an account that became delinquent years earlier, but it shows how much enforcement activity the IRS generated relative to the new collection workload.
| Measure | FY 2014 | FY 2019 | FY 2022 | FY 2025 |
|---|---|---|---|---|
| Liens per 1,000 new delinquent accounts | 69.9 | 68.5 | 26.1 | 27.1 |
| Levies per 1,000 new delinquent accounts | 260.6 | 98.7 | 45.3 | 42.9 |
| Delinquent accounts in inventory per lien filed | 23 | 21 | 60 | 61 |
| Delinquent accounts in inventory per levy | 6 | 14 | 34 | 39 |
| Delinquent accounts in inventory per seizure | 28,727 | 49,255 | 105,388 | 262,250 |
| Average balance per delinquent account | $10,525 | $11,198 | $12,818 | $16,132 |
On this basis the 2022 to 2025 recovery in liens and levies is mostly a recovery in volume, not in intensity. Liens per 1,000 new delinquent accounts were 26.1 in 2022 and 27.1 in 2025, compared with 69.9 in 2014, a decline of 61.2 percent. Levies per 1,000 were 42.9 in 2025, down 83.5 percent from 260.6 in 2014. The inventory measure tells the same story: in 2014 there was one lien for every 23 delinquent accounts on the books at year end, and in 2025 one for every 61.
Two developments in the collection pipeline explain the timing of the recent increase, according to TIGTA. The IRS restarted several notice programs in February 2024 that had been paused intermittently since the pandemic, including balance due notices, notices of intent to levy, and nonfiler programs, and the Automated Collection System resumed levies in April 2025. The Data Book shows the downstream effect in the nonfiler work: new taxpayer delinquency investigations, which the IRS opens when a taxpayer does not respond to a notice about an unfiled return, rose from 639,143 in fiscal year 2024 to 2,501,667 in 2025. Our guide to the IRS CP504 notice covers the notice that usually precedes enforcement on a balance due.
How Did Each Enforcement Tool Change Before and After the Pandemic?
Each tool followed its own path. Before the pandemic, from 2014 to 2019, liens were flat while levies fell 60.8 percent and seizures 47.2 percent. From 2019 to 2022 all three collapsed. Since 2022 liens and levies have recovered part of the ground, but seizures fell another 43.8 percent.
| Period | Liens filed | Levies on third parties | Seizures |
|---|---|---|---|
| FY 2014 to FY 2019, before the pandemic | +1.5% | −60.8% | −47.2% |
| FY 2019 to FY 2022, pandemic pauses | −71.1% | −65.1% | −61.0% |
| FY 2022 to FY 2025, restart | +36.1% | +24.1% | −43.8% |
| FY 2014 to FY 2025, full period | −60.0% | −83.0% | −88.4% |
The split matters for anyone quoting a trend. The fall in levies was mostly a pre pandemic story: more than 60 percent of the 2014 volume was gone by 2019, before any relief measure. Lien filings, by contrast, stayed between about 410,000 and 545,000 a year through 2019 and then dropped by more than two thirds in three years, which is why the lien recovery since 2022 looks large in percentage terms but remains small in absolute terms. Seizures are the only tool that declined in every period, including the restart years, which is consistent with TIGTA’s observation that the decline in seizures coincides with the decline in revenue officers.
- Levies: a long slide, then a floor. The count has stayed within a band of about 66,000 since 2021.
- Liens: flat, then a cliff, then a partial climb. Fiscal year 2025 filings are still below every year from 2014 through 2020.
- Seizures: down in every period. Fiscal year 2025 is the lowest year of the series and the only year below 68.
How Much Do Taxpayers Owe the IRS in Delinquent Accounts?
At the end of fiscal year 2025 the IRS carried 13,112,485 taxpayer delinquent accounts with a balance of $211.5 billion in assessed tax, penalties, and interest. That balance is the highest in the twelve year series and 61.9 percent above fiscal year 2014. It excludes penalties and interest that have accrued but not yet been assessed.
The balance was remarkably stable for most of the series, between $114.3 billion and $138.2 billion every year from 2014 through 2022. It then rose to $158.6 billion in 2023 and $208.4 billion in 2024, an increase of $88.2 billion in two years, before edging up to $211.5 billion in 2025. The account count did not grow nearly as fast: 13.1 million at the end of 2025 compared with 12.4 million in 2014, an increase of 5.7 percent. The average balance per delinquent account therefore climbed from $10,525 in 2014 to $16,132 in 2025.
- The inventory peaked in 2024. Ending inventory reached 14,901,508 accounts in fiscal year 2024, the highest in the series, before the IRS closed 9,688,767 accounts in 2025 and brought it down to 13,112,485.
- Interest is part of the growth. Assessed penalties and interest are included in the balance, and IRS underpayment interest rates rose after 2022, so part of the increase likely reflects the cost of carrying old debt rather than new debt alone.
- Collections rose while enforcement fell. Net collections on returns filed with additional tax due reached $73.1 billion in 2025, compared with $34.2 billion in 2014, in current dollars. The table does not split collections by the action that produced them.
- Payment plans dwarf enforcement. The IRS established 3,160,047 new installment agreements in fiscal year 2025, more than nine times the number of levies.
The National Taxpayer Advocate’s 2025 report adds a measure of what happens to accounts that are not worked: 18.5 percent of delinquent taxpayer cases were pending assignment in the collection queue in fiscal year 2025, and the average individual delinquency in the queue was 4.9 years old. Every year a debt waits is a year of the ten year collection period under section 6502 running down, which our guide to the IRS 10 year rule for tax debt explains.
Why Has IRS Enforcement Fallen So Far?
The published record points to staffing and pandemic pauses. TIGTA ties the fall in lien filings and seizures to a steady decline in revenue officers, and it documents a three year pause in Automated Collection System levies. Revenue officers fell from 3,418 in fiscal year 2024 to 2,544 in 2025, according to TIGTA.
This report does not attribute the trend to any single cause, and the Data Book does not explain its own counts. The independent oversight record, however, is consistent. TIGTA’s 2024 lien review states that the decline in lien filings tracks the decline in revenue officers. Its 2025 seizure review states that the steady decline in seizures since fiscal year 2016 generally coincides with a steady decline in revenue officers over the same period. Its trends report for fiscal year 2025 records 3,418 revenue officers in 2024 and 2,544 in 2025, a reduction of 25.6 percent, and its levy review reports that Automated Collection System staffing was reduced by 1,704 employees, or 42 percent, during calendar year 2025.
Staffing does not explain everything. Levies fell by more than 1.4 million between 2014 and 2017, years before the pandemic, and TIGTA reports that the People First Initiative suspended new notices of liens and levies from April to July 2020. What the data does show clearly is that the IRS has not rebuilt enforcement to its earlier scale, even as the balance owed reached a record. TIGTA’s trends report also notes a counterpoint: Field Collection enforcement revenue rose from approximately $5 billion in fiscal year 2024 to $8.2 billion in 2025, which TIGTA says is likely due to increased revenue from the restart of collection notices combined with reduced year end staffing.
Why Do Other Sources Report Different Lien, Levy, and Seizure Numbers?
Mostly because they count a different twelve months or a narrower population. TIGTA reviews run from July to June, while the Data Book uses the October to September fiscal year. The one true revision is fiscal year 2023 seizures: first reported as 65, later corrected to 68. This report uses the corrected figure throughout.
| Published figure | Their number | Data Book basis in this report | Why they differ |
|---|---|---|---|
| TIGTA 2024-300-054, seizures, fiscal year 2023 | 65 | 68 | Original Data Book count; TIGTA later found three seizures missing from the IRS seizure log |
| TIGTA 2026-300-043, seizures, July 2024 to June 2025 | 49 | 50 (fiscal year 2025) | Review period ends three months earlier than the fiscal year |
| TIGTA 2024-300-054, seizures, July 2022 to June 2023 | 73 | 89 (FY 2022), 68 (FY 2023) | Review window straddles two fiscal years |
| TIGTA 2025-300-043, seizures reviewed | 105 | 71 (fiscal year 2024) | Review population added seizures omitted from the prior review |
| TIGTA 2024-300-037, lien notices prepared, July 2022 to June 2023 | 166,676 | 179,019 (fiscal year 2023) | Notices prepared in a July to June window, versus lien requests entered in the fiscal year |
| TIGTA 2026-300-035, Automated Collection System systemic levies, April 21 to June 30, 2025 | 4,860 | 339,137 (fiscal year 2025) | Ten weeks, one issuing unit, systemic levies only |
TIGTA’s statement that the fiscal year 2023 Data Book reported 65 seizures appears in Report 2025-300-043; the 65 figure also appears in TIGTA Report 2024-300-054, Figure 1. The fiscal year 2023 count is 68 in the revised 2023 workbook, in the 2023 Data Book PDF currently posted by the IRS, in the 2024 edition, and in TIGTA Report 2026-300-043. The original 2023 file showing 65 is no longer posted and was not examined for this report.
On the fiscal year basis, every independent figure this report found agrees with the Data Book series. TIGTA’s August 2026 seizure review prints a five year table of 96, 89, 68, 71, and 50 for fiscal years 2021 through 2025, identical to the series here. TIGTA’s 2024 lien review gives 157,323 notices for fiscal year 2022 and a 67 percent decline from 2019 to 2023, both of which reproduce. The National Taxpayer Advocate’s figures for new installment agreements in fiscal years 2023 to 2025 (2,696,963, 3,403,214, and 3,160,047) and for offers in compromise submitted (30,163, 33,591, and 38,797) match the same Data Book table to the unit. Two cautions apply. TIGTA’s tables draw on the Data Book and on IRS collection reports, so their agreement confirms the series was compiled correctly rather than providing a fully separate count; the one time TIGTA audited the underlying seizure log, it found the 2023 undercount. And the baseline year matters as much as the headline year when a decline is quoted: the fiscal year 2014 baseline appears in only one edition, the 2015 Data Book, and no other body found in this sweep publishes it.
The levy count deserves one more caution. Any figure that includes the Federal Payment Levy Program, the State Income Tax Levy Program, or the other automated levy programs is measuring a broader population than the Data Book and will be higher. The Data Book series in this report is internally consistent across all eleven editions, which is what makes the twelve year comparison valid.
What Do These Numbers Not Show?
They do not show how many people were affected, how much each action collected, or how enforcement varies by state. They count actions, not taxpayers, and the levy count leaves out the automated levy programs. Dollar balances are in current dollars and include assessed interest, so part of their growth reflects inflation and higher interest rates.
- Actions are not taxpayers. One taxpayer can generate several lien notices and many levies in a single year, so the counts cannot be read as the number of people affected.
- The account count is not defined as taxpayers or modules. The Data Book reports the number of taxpayer delinquent accounts without stating the unit, and the National Taxpayer Advocate reports separate taxpayer and module measures from internal reports, so this study uses the Data Book count only for ratios within the same table.
- There is no geography. The Data Book reports collection activity nationally, so the series cannot say whether Florida or any other state sees more or fewer liens.
- Older editions are rounded. Editions before 2019 report delinquent account counts in thousands, which affects the ratios for 2014, 2015, and 2017 only at the third significant digit.
The series also cannot show intent or policy. A falling count can reflect fewer staff, a deliberate choice to resolve cases through payment plans, a higher internal threshold for filing, or a pause ordered for taxpayer relief. Where TIGTA or the National Taxpayer Advocate has documented a reason, this report cites it; where no one has, it says nothing.
What Should You Do If You Receive a Notice of Intent to Levy?
Act inside the 30 day window. A final notice of intent to levy, Letter 1058 or LT11, carries the right to a Collection Due Process hearing if you file Form 12153 within 30 days. A timely request generally suspends levy action while the hearing is pending and lets you propose a payment plan or other alternative.
| Stage | Typical notice | Legal basis | What the data says |
|---|---|---|---|
| Balance due reminders | CP14, CP501, CP503 | Notice and demand, section 6303 | No enforcement yet; a payment plan can still be set up online |
| Intent to levy | CP504 | Section 6331(d) | Notice programs restarted in February 2024, per TIGTA |
| Final notice with hearing rights | Letter 1058 or LT11 | Section 6330 | Required at least 30 days before the first levy for a period |
| Lien notice filed | Letter 3172 after filing | Sections 6321 and 6320 | 214,099 notices filed in fiscal year 2025 |
| Levy on third parties | Form 668-A or 668-W to the bank or employer | Section 6331 | 339,137 levies in fiscal year 2025 |
| Seizure of property | Field Collection seizure | Sections 6330 to 6344 | 50 seizures in fiscal year 2025 |
The hearing is the most valuable right in the sequence, and it is lost if the deadline passes. A request on Form 12153 moves the case to the IRS Independent Office of Appeals, where the taxpayer can propose an installment agreement, an offer in compromise, or currently not collectible status, and in some cases challenge the underlying liability. TIGTA’s July 2026 review found that the IRS substantially complied with the hearing rules but still identified ten taxpayers who were levied while a timely hearing request was pending, three of them because the request was mailed to the wrong address. Send the request to the address on the notice, keep proof of mailing, and follow up. Our full guide to the Collection Due Process hearing walks through each step.
The broader lesson of the data is that enforcement is the exception, not the rule. In fiscal year 2025 the IRS set up more than nine new installment agreements for every levy it requested. A taxpayer who responds, files any missing returns, and proposes a realistic payment arrangement before the final notice is very unlikely to see a levy at all. Our guides to IRS installment agreement options and to currently not collectible status explain how each alternative works.
How Was This Report Prepared?
Methodology. Tax Expert Today extracted the Delinquent Collection Activities table from eleven consecutive editions of the IRS Data Book: Table 16 in the 2015, 2016, 2017, and 2018 editions; Table 25 in the 2019 through 2022 editions; Table 27 in the 2023 (revised) and 2024 editions; and Table 4-1 in the 2025 edition. The table number history was read from each file’s own caption. Each edition reports two fiscal years, so every year from 2015 through 2024 appears in two editions, and the overlapping values were compared line by line for liens, levies, seizures, delinquent account counts and balances, collections, installment agreements, and offers in compromise: there were no conflicts. Each year in the series is taken from the latest edition that holds it. Editions before 2019 state delinquent account counts in thousands, and those were converted to units. The fiscal year 2025 and fiscal year 2023 counts for liens, levies, and seizures were also checked against the typeset tables in the printed Data Book PDFs, and all matched.
Ratios use only numerator and denominator from the same table and the same fiscal year. A corroboration sweep covered TIGTA’s seizure reviews for 2024, 2025, and 2026, its 2024 lien review, its 2026 levy review, its trends report through fiscal year 2025, and the National Taxpayer Advocate 2025 Annual Report to Congress. Nine figures published by other bodies reproduce exactly from the series, including TIGTA’s five year seizure table and the Advocate’s installment agreement and offer counts; every divergent figure found reflects a different period or population and is disclosed above. Only a handful of sources publish this series across editions. All source files, extraction scripts, and a workpaper mapping every published figure to its source and calculation are retained and available on request. The full twelve year dataset is downloadable as a machine readable file: tet-irs-liens-levies-seizures-fy2014-2025.csv. The data may be reused with attribution to Tax Expert Today LLC.
IRS Levy Help Naples: Local Representation
Tax Expert Today LLC represents individuals and businesses in Naples, Florida and across Southwest Florida when the IRS moves from notices to enforcement, from a first lien notice to a bank levy, a wage levy, or a revenue officer assigned to a business. The firm is multidisciplinary, with enrolled agents, CPAs, and attorneys, and represents taxpayers before the IRS nationwide. Collier County is home to many business owners, real estate investors, and retirees whose balances can reach the size that this report shows draws a revenue officer and, in rare cases, a seizure. The office is at 11983 Tamiami Trail N, Naples, FL 34110, and the team can be reached at (239) 441-2005, Monday through Friday, 10am to 5pm ET. Our Naples tax resolution page describes how the firm handles liens, levies, and collection alternatives, and our IRS resolution and audit support page covers representation nationwide.
Frequently Asked Questions
How many tax liens did the IRS file in 2025?
The IRS filed 214,099 notices of federal tax lien in fiscal year 2025, which ran from October 2024 through September 2025. That was 8.7 percent more than in 2024 and 36.1 percent more than the 2022 low of 157,323, but 60.0 percent fewer than the 535,580 filed in fiscal year 2014.
How many levies does the IRS issue each year?
The IRS requested 339,137 levies on third parties through the Automated Collection System and Field Collection in fiscal year 2025, up from 313,792 in 2024. The count was 1,995,987 in fiscal year 2014. It excludes automated programs such as the Federal Payment Levy Program, which are reported separately.
How many property seizures does the IRS make?
The IRS conducted 50 seizures in fiscal year 2025, the fewest in the twelve years from 2014 to 2025 and down from 71 in 2024 and 432 in 2014. TIGTA reports an average of 75 seizures a year over fiscal years 2021 to 2025, mostly of real estate owned by taxpayers with large balances.
Is the IRS increasing collection enforcement?
Modestly. Liens and levies have risen for three straight years since fiscal year 2022, and the Automated Collection System resumed levies in April 2025 after a pause that began in 2020. Measured per new delinquent account, however, enforcement in 2025 was 61 to 84 percent below its 2014 level, and seizures kept falling.
How much do taxpayers owe the IRS in delinquent accounts?
At the end of fiscal year 2025, the IRS carried 13,112,485 taxpayer delinquent accounts with $211.5 billion in assessed tax, penalties, and interest, the highest balance in the twelve year series. The figure excludes penalties and interest that have accrued but not been assessed, and it is in current dollars.
Where can I get help with an IRS lien or levy in Naples, Florida?
Tax Expert Today LLC, located at 11983 Tamiami Trail N, Naples, FL 34110, represents taxpayers in Naples and across Southwest Florida facing IRS liens, bank and wage levies, and revenue officer cases. The firm is multidisciplinary, with enrolled agents, CPAs, and attorneys, and represents clients before the IRS nationwide. Consultations can be arranged at (239) 441-2005.
When to Engage a Professional About an IRS Lien or Levy
A balance that is still in the reminder notice stage can often be resolved directly, by paying, by setting up an online payment plan, or by filing a missing return. Professional representation earns its place when a final notice of intent to levy has arrived and the 30 day hearing window is running, when a levy has already reached a bank account or paycheck, when a notice of federal tax lien is blocking a sale or refinance, when a revenue officer has been assigned, or when the balance involves payroll taxes or several years. The data in this report shows why timing matters: enforcement is rare relative to the size of the delinquent inventory, but when it comes, it falls on the accounts that did not respond, and the most powerful protection, the Collection Due Process hearing, is available only before the deadline passes. Tax Expert Today LLC represents individuals and businesses before the IRS nationwide, and Dr. Kabashi, the firm’s founder, leads the practice. Our companion research on the IRS offer in compromise acceptance rate, on IRS civil penalties assessed and abated, and on IRS audit rates by income applies the same method to other IRS data.
Call (239) 441-2005 or schedule a consultation to review a lien, a levy notice, or an open collection case. Tax advisors, enrolled agents, CPAs, and attorneys serving clients in all 50 states.
Published November 2, 2026 by Dr. Pellumb Kabashi « Back to Learning Center
Have a question this article touches on?
Tax Expert Today LLC, based in Naples, Florida and serving clients across the United States.
Schedule a Consultation (239) 441-2005