
By Dr. Pellumb Kabashi, DBA, MBA, CES, CFE, EA
Founder, Tax Expert Today LLC · Tax advisors, enrolled agents, CPAs, and attorneys · Serving clients in all 50 states
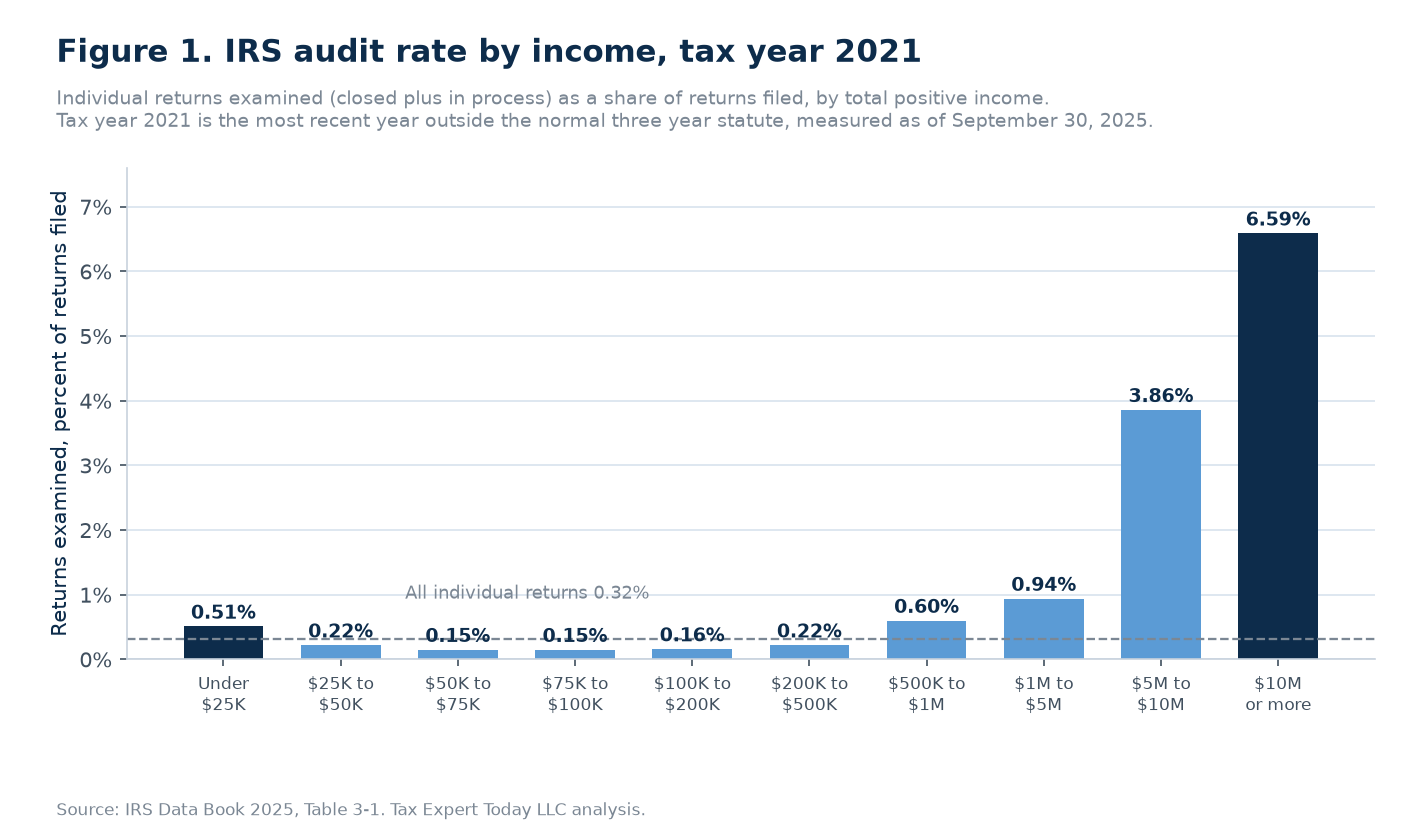
Quick Answer: IRS audit rates by income follow a U shape. For tax year 2021, the newest year past the normal three year audit window, the IRS examined 0.51 percent of returns reporting under $25,000 of income, 0.16 percent of returns between $100,000 and $200,000, and 6.59 percent of returns reporting $10 million or more. The overall rate was 0.32 percent. Call (239) 441-2005 for a free consultation.
Published: October 2, 2026
Tax Expert Today Research · Report 2026-04
The IRS Audit Odds Report, Tax Years 2010 to 2023. An original analysis of six consecutive editions of the IRS Data Book examination coverage table, 2020 through 2025, read side by side so that every tax year can be compared at the same point in its audit life. Every figure was computed from the IRS source files and reconciled to the printed Data Book. This report is updated annually when the IRS releases a new Data Book. Download the PDF edition or browse all TET Research reports.
The question taxpayers ask most about audits is a simple one: what are the odds? The IRS answers it once a year in a single table of its Data Book, which counts the returns examined for each tax year against the returns filed, broken out by income. That table is widely quoted and frequently misread, because it is a snapshot. A tax year keeps acquiring audits for at least three years after the return is filed, so the most recent years always look deceptively quiet. Tax Expert Today read six consecutive editions of the table, 2020 through 2025, and lined them up so that every tax year can be measured at the same age. This report sets out the IRS audit rates by income on that basis, what the latest edition shows about who is being examined, and why other published figures for the same years differ. For what an examination actually involves once the letter arrives, our guide to what happens if you get audited by the IRS walks through each stage.
What Are the IRS Audit Rates by Income?
For tax year 2021, measured as of September 30, 2025, the IRS examined 0.32 percent of individual returns. Returns under $25,000 of total positive income were examined at 0.51 percent, every band from $25,000 to $500,000 at between 0.15 and 0.22 percent, $1 million to $5 million at 0.94 percent, and $10 million or more at 6.59 percent.
- The low end is audited more than the middle. A return under $25,000 was 3.2 times as likely to be examined as a return between $100,000 and $200,000.
- The middle is the quietest place in the tax system. Returns from $50,000 to $200,000 were examined at 0.15 to 0.16 percent, roughly 1 in 650.
- The odds climb steeply above $1 million. From 1 in 106 at $1 million to $5 million, to 1 in 26 at $5 million to $10 million, to 1 in 15 at $10 million or more.
- Total positive income is not adjusted gross income. The IRS sorts returns by the sum of every positive income item, ignoring losses, so a return with large offsetting losses can sit in a higher band than its AGI suggests.
Tax year 2021 is the right year to headline because the IRS itself identifies it as “the most recent year outside of the normal statute period” in the 2025 Data Book. The general assessment period under section 6501 is three years from the date a return is filed, so for most 2021 returns the window to open a new examination has closed and the rate is close to final. Later tax years are still filling up, and quoting them as if they were complete is the most common error in published audit statistics. Our explainer on the IRS audit statute of limitations covers the three year rule and the six year and unlimited exceptions in detail.
| Total positive income, TY 2021 | Returns filed | Returns examined | Audit rate | Odds |
|---|---|---|---|---|
| $1 under $25,000 | 44,983,091 | 227,506 | 0.51% | 1 in 198 |
| $25,000 under $50,000 | 37,679,393 | 82,905 | 0.22% | 1 in 454 |
| $50,000 under $75,000 | 23,132,910 | 34,900 | 0.15% | 1 in 663 |
| $75,000 under $100,000 | 14,828,621 | 22,920 | 0.15% | 1 in 647 |
| $100,000 under $200,000 | 24,900,466 | 40,069 | 0.16% | 1 in 621 |
| $200,000 under $500,000 | 9,597,600 | 21,062 | 0.22% | 1 in 456 |
| $500,000 under $1,000,000 | 1,779,838 | 10,645 | 0.60% | 1 in 167 |
| $1,000,000 under $5,000,000 | 867,592 | 8,174 | 0.94% | 1 in 106 |
| $5,000,000 under $10,000,000 | 71,862 | 2,771 | 3.86% | 1 in 26 |
| $10,000,000 or more | 51,250 | 3,375 | 6.59% | 1 in 15 |
| All individual returns | 161,206,833 | 510,375 | 0.32% | 1 in 316 |
| Returns claiming the EITC (shown separately) | 32,216,183 | 224,123 | 0.70% | 1 in 144 |
Source: IRS Data Book 2025, Table 3-1, tax year 2021 columns. Returns examined are examinations closed by September 30, 2025 plus examinations in process on that date. The audit rate is returns examined divided by returns filed; it reproduces the percentage the IRS publishes for every row. The “no total positive income” and international return rows are omitted. EITC returns are already counted in the income rows and are shown separately for comparison, as the IRS does.
Why Are the Lowest Earners Audited More Than the Middle Class?
Mostly because of the Earned Income Tax Credit. Returns claiming the credit made up 20.0 percent of tax year 2021 individual returns but 43.9 percent of all individual examinations, an audit rate of 0.70 percent. The GAO reports that IRS officials attribute this to the credit’s high improper payment rate and to EITC audits being limited in scope.
The arithmetic of the low end is striking. Returns under $25,000 of total positive income were 27.9 percent of all returns filed for tax year 2021, yet they absorbed 44.6 percent of all individual examinations. Taken together, every band below $200,000 accounted for 80.0 percent of examinations against 90.3 percent of returns, so the middle bands are examined well below their share of filings while the bottom band is examined well above it. In the GAO’s May 2022 testimony to the House Ways and Means Oversight Subcommittee, IRS officials explained that “EITC audits are limited in scope and historically have high rates of improper payments and therefore require a greater enforcement presence.”
- Most low income audits are by mail. The 2025 Data Book reports that 81.0 percent of all examinations closed in fiscal year 2025 were correspondence audits and 19.0 percent were field examinations.
- Many low income audits end without a reply. The National Taxpayer Advocate’s 2025 report shows that for audited taxpayers under $50,000 of total positive income the failed to respond rate reached 64.3 percent in fiscal year 2025, up from 47.2 percent in fiscal year 2023.
- The volume is shrinking at the bottom too. TIGTA found that EITC examination starts fell 53 percent between fiscal years 2023 and 2024 as the IRS shifted examiner time to other audits.
The non-response figure matters because an unanswered correspondence audit does not simply close. It generally proceeds to a notice of deficiency, and once the period to petition the Tax Court passes the IRS can assess the proposed tax. Taxpayers in that position are not without options afterward, and IRS audit reconsideration exists precisely for assessments made without the taxpayer’s information, but it is a slower and harder road than answering the original letter. An assessment made that way is followed by balance due notices that begin with the CP14 notice.
How Have IRS Audit Rates Changed Since 2015?
They fell in every income band. Between tax years 2015 and 2021, both measured in the same 2025 edition, the overall rate fell 45 percent, from 0.58 to 0.32 percent. The middle bands fell most, by 67 to 72 percent between $50,000 and $200,000, while the under $25,000 band fell least, by 23 percent.
Measuring both years in a single edition matters here. Tax years 2015 and 2021 are both past the normal statute in the 2025 Data Book, so neither rate is still filling up, and the comparison is like for like. The longer view is starker still. The earliest year available in the six editions, tax year 2010, measured in the 2020 Data Book, shows an overall rate of 1.01 percent and a rate of 21.48 percent for returns of $10 million or more, against 0.32 and 6.59 percent for tax year 2021.
| Total positive income | TY 2010 | TY 2015 | TY 2021 | Change, 2015 to 2021 |
|---|---|---|---|---|
| $1 under $25,000 | 1.03% | 0.66% | 0.51% | −23% |
| $25,000 under $50,000 | 0.61% | 0.40% | 0.22% | −45% |
| $50,000 under $75,000 | 0.69% | 0.54% | 0.15% | −72% |
| $75,000 under $100,000 | 0.65% | 0.50% | 0.15% | −70% |
| $100,000 under $200,000 | 0.85% | 0.48% | 0.16% | −67% |
| $200,000 under $500,000 | 2.28% | 0.56% | 0.22% | −61% |
| $500,000 under $1,000,000 | 3.62% | 1.22% | 0.60% | −51% |
| $1,000,000 under $5,000,000 | 8.19% | 2.61% | 0.94% | −64% |
| $5,000,000 under $10,000,000 | 13.54% | 5.17% | 3.86% | −25% |
| $10,000,000 or more | 21.48% | 9.49% | 6.59% | −31% |
| All individual returns | 1.01% | 0.58% | 0.32% | −45% |
Source: IRS Data Book 2025, Table 3-1 (tax years 2015 and 2021) and IRS Data Book 2020, Table 17 (tax year 2010). All three tax years are outside the normal three year statute in the edition used. Percentage changes are computed on unrounded rates.
The 2010 to 2021 pattern is the one the IRS has described itself. In its April 2023 statement on the 2022 Data Book, the agency said that “continued resource constraints have limited the agency’s ability to address high-end noncompliance.” The GAO reached a similar conclusion in 2022, reporting that audit rates fell for all income levels from tax years 2010 to 2019 and fell most for taxpayers with incomes of $200,000 and above, because those audits are more complex and require more examiner time.
Why Do Recent Audit Rates Look So Low?
Because each Data Book is a snapshot and recent tax years are still being audited. For returns of $10 million or more, the rate the Data Book reported two years after tax year 2019 was 2.01 percent. The same tax year now stands at 11.55 percent. Quoting a recent year as final can understate the eventual rate several times over.
The IRS says this plainly in the notes to the table. Each edition is “a ‘snapshot’ in time of the examination process,” and “as new audits of returns filed for recent tax years are opened, audit rates for those years will increase.” What the notes do not show is the size of the effect, because a single edition cannot. Reading six editions together makes it visible. For the top band, every tax year from 2018 to 2021 roughly doubled or more between the edition two years after the tax year and the 2025 edition, from 5.32 to 10.58 percent for tax year 2018 and from 2.01 to 11.55 percent for tax year 2019. Tax year 2022 has had only one further year to grow and has already gone from 3.95 to 6.57 percent.
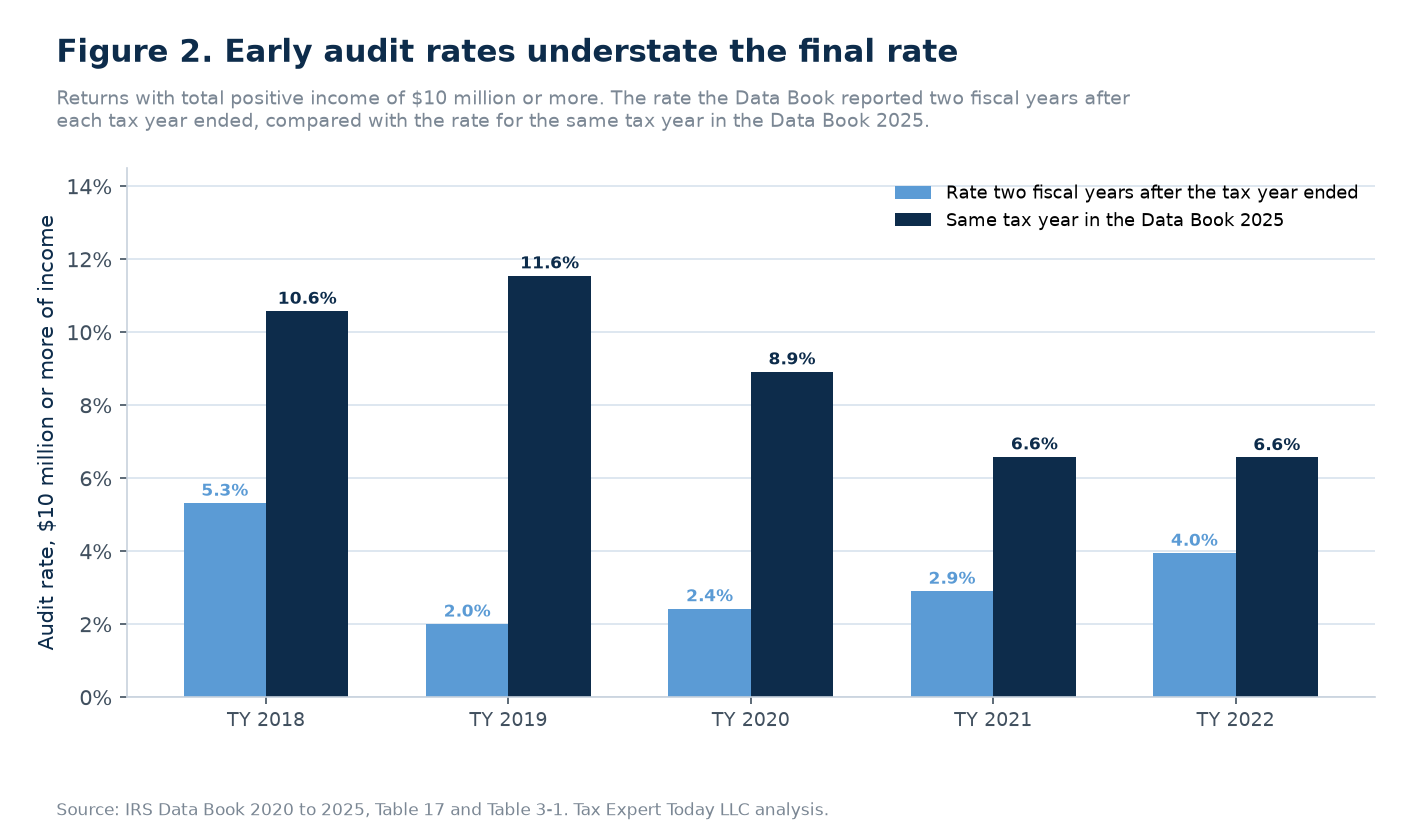
The effect is far smaller in the low and middle bands, which is itself informative. For returns under $25,000, tax year 2019 moved only from 0.37 percent two years on to 0.44 percent today. The GAO testimony describes lower income audits as generally less complex and more automated, while higher income audits require examiners to review multiple issues by hand, and the slower growth at the low end is consistent with that. The practical rule is that a recent tax year understates the audit odds for high income returns much more than it does for everyone else.
Are IRS Audits of High Earners Increasing?
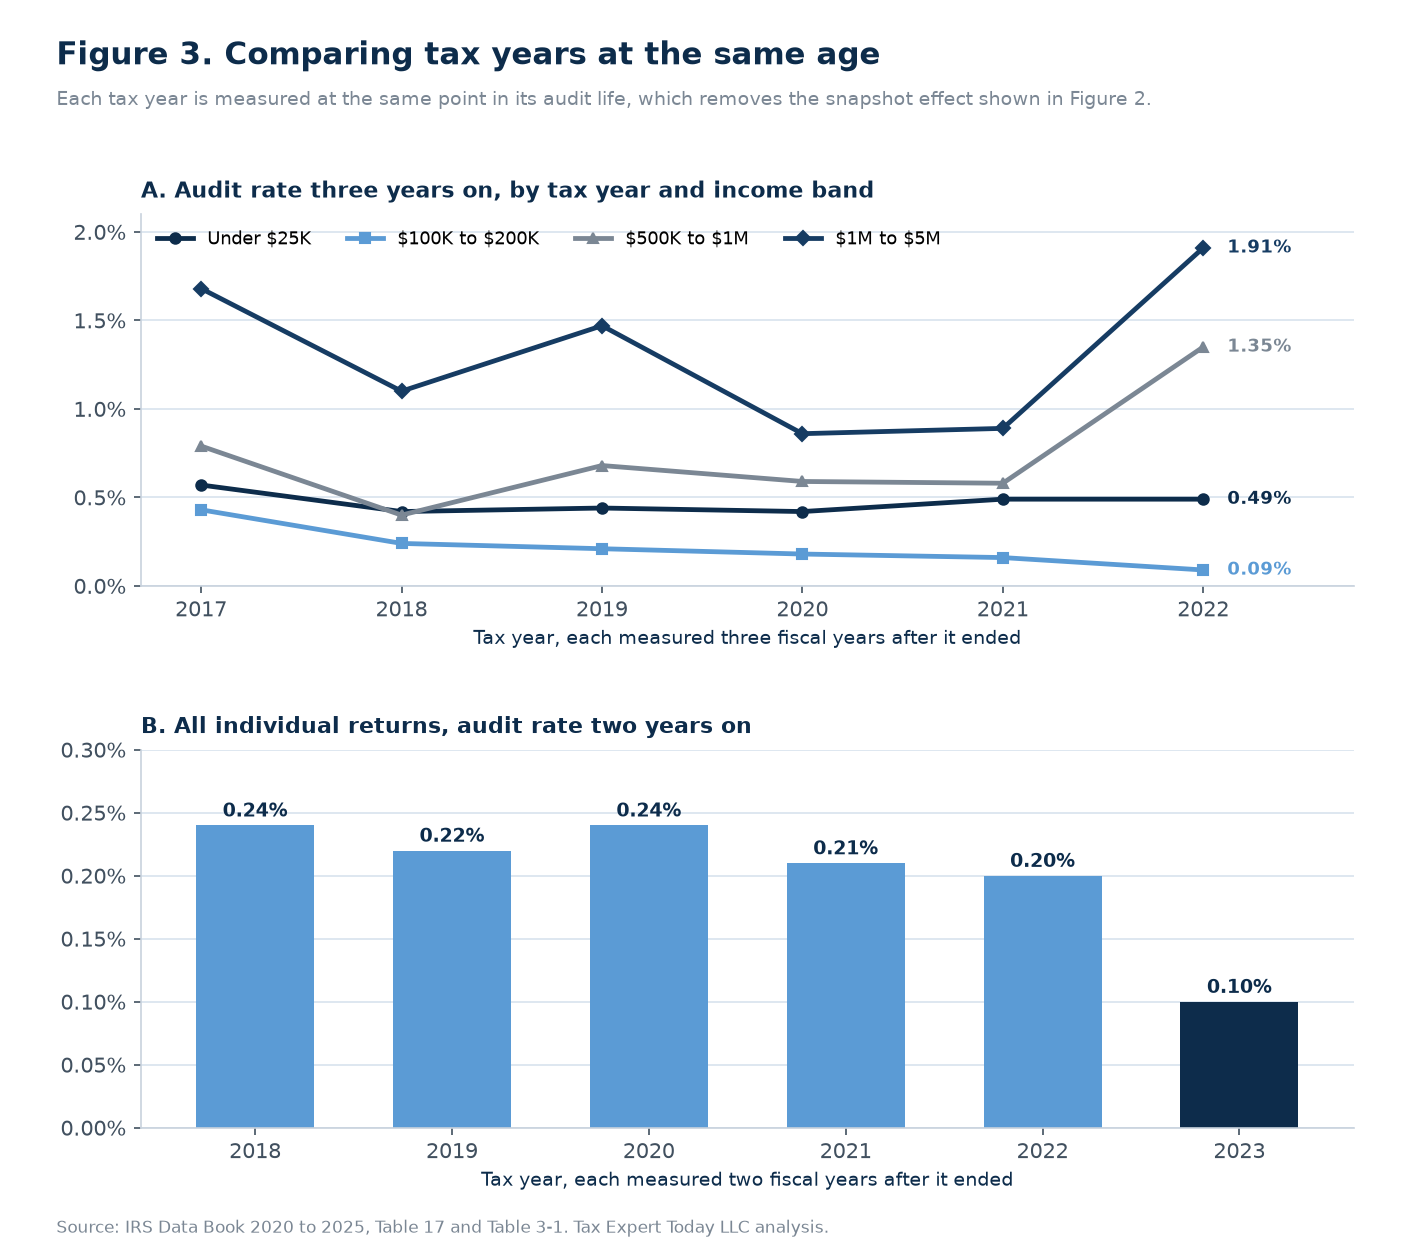
For tax year 2022, yes, between $200,000 and $10 million. Measured three years after the tax year, the audit rate for $1 million to $5 million returns was 1.91 percent against 0.89 percent for tax year 2021 at the same age, and $500,000 to $1 million rose from 0.58 to 1.35 percent. Returns of $10 million or more were roughly flat.
This is the comparison the snapshot problem otherwise hides. Tax year 2022 is still inside the normal statute, so its raw rate in the 2025 edition cannot be set against the near final rate for tax year 2021. Set against tax year 2021 as it stood in the 2024 edition, three years after that tax year ended, the shift is unambiguous. Every band from $200,000 to $10 million is higher than at the same age in any of the four earlier tax years shown in the table below, while every band from $50,000 to $200,000 is lower.
| Audit rate three years after the tax year | TY 2018 | TY 2019 | TY 2020 | TY 2021 | TY 2022 |
|---|---|---|---|---|---|
| $1 under $25,000 | 0.42% | 0.44% | 0.42% | 0.49% | 0.49% |
| $50,000 under $75,000 | 0.21% | 0.18% | 0.17% | 0.14% | 0.11% |
| $100,000 under $200,000 | 0.24% | 0.21% | 0.18% | 0.16% | 0.09% |
| $200,000 under $500,000 | 0.25% | 0.24% | 0.25% | 0.21% | 0.35% |
| $500,000 under $1,000,000 | 0.40% | 0.68% | 0.59% | 0.58% | 1.35% |
| $1,000,000 under $5,000,000 | 1.10% | 1.47% | 0.86% | 0.89% | 1.91% |
| $5,000,000 under $10,000,000 | 1.95% | 2.70% | 2.01% | 3.71% | 4.95% |
| $10,000,000 or more | 8.70% | 10.19% | 8.25% | 6.21% | 6.57% |
| All individual returns | 0.32% | 0.30% | 0.28% | 0.31% | 0.29% |
Source: IRS Data Book editions 2021 to 2025, Table 17 and Table 3-1. Each column is read from the edition published three fiscal years after the tax year ended: tax year 2018 from the 2021 edition, tax year 2022 from the 2025 edition, and so on. Every rate is therefore measured at the same point in its audit life.
The timing lines up with the IRS’s stated plan. The agency’s 2024 Strategic Operating Plan supplement set a target of raising the audit rate for individuals with $10 million or more of total positive income from 11.0 percent for tax year 2019 to 16.5 percent for tax year 2026. TIGTA reported that examinations of returns above $400,000 rose to 17 percent of planned audit starts in fiscal year 2024, almost 2.5 times the average for fiscal years 2019 through 2023. The data in this report shows the effect of that shift arriving below the very top: the $10 million band for tax year 2022 is not yet above where tax year 2019 stood at the same age.
Is the IRS Auditing Fewer 2023 Returns?
So far, far fewer. Two years after the tax year, the IRS had examined 0.10 percent of tax year 2023 individual returns, half the 0.20 percent recorded for tax year 2022 at the same age and the lowest early rate of the six years compared. Only the $10 million or more band was higher, at 5.16 percent against 3.95 percent.
An early rate is not a final rate, and tax year 2023 will keep acquiring audits until its statute closes. But because every year in the comparison is measured at exactly two years, the snapshot effect cannot explain the gap; tax years 2018 through 2022 all sat between 0.20 and 0.24 percent at the same point. The drop is broad, running from 0.38 to 0.16 percent for returns under $25,000 and from 1.07 to 0.22 percent for returns of $1 million to $5 million.
The external record is consistent with a capacity story, although this report does not attempt to prove one. TIGTA’s August 2026 review of compliance trends found that examinations of individual returns started fell 31 percent from fiscal year 2024 to fiscal year 2025, examinations of taxpayers with incomes over $400,000 fell 27 percent, and the IRS lost approximately 27 percent of its Examination and Collection staff over the same year. Whether tax year 2023 catches up with earlier years will depend on staffing that the 2025 Data Book cannot show, and the 2026 edition will be the first real test.
What Are the Odds of Being Audited, and What Does an Audit Find?
The odds range from about 1 in 650 in the middle bands to 1 in 15 at $10 million or more, but what an audit finds varies as much as the odds. For tax year 2021, 42.9 percent of closed examinations of $10 million returns ended with no change to tax, against 9.9 percent for returns between $50,000 and $100,000.
| Total positive income, TY 2021 | Odds of examination | Closed with no change | Recommended tax per closed exam |
|---|---|---|---|
| $1 under $25,000 | 1 in 198 | 15.2% | $9,592 |
| $25,000 under $50,000 | 1 in 454 | 12.3% | $8,315 |
| $50,000 under $75,000 | 1 in 663 | 9.9% | $8,624 |
| $75,000 under $100,000 | 1 in 647 | 9.9% | $9,041 |
| $100,000 under $200,000 | 1 in 621 | 11.9% | $9,494 |
| $200,000 under $500,000 | 1 in 456 | 21.0% | $12,609 |
| $500,000 under $1,000,000 | 1 in 167 | 26.5% | $17,044 |
| $1,000,000 under $5,000,000 | 1 in 106 | 20.9% | $42,933 |
| $5,000,000 under $10,000,000 | 1 in 26 | 39.7% | $73,208 |
| $10,000,000 or more | 1 in 15 | 42.9% | $175,231 |
Source: IRS Data Book 2025, Table 3-1, tax year 2021. No change share is closed examinations with no change divided by closed examinations. Recommended tax per closed exam is recommended additional tax divided by closed examinations; it is an average across all closed examinations including no change cases, it is the amount recommended rather than the amount assessed or collected, and it is not a prediction for any individual taxpayer.
Two cautions go with this table. The IRS notes that no change examinations close faster than examinations that produce an adjustment, so the no change share for a recent year can fall as the remaining cases close. And recommended tax is not collected tax: the GAO testimony reported that the IRS collected about 47 percent of the additional taxes recommended in individual audits closed in fiscal years 2011 to 2020. The table describes the population of audits, not the likely outcome of any one.
Why Do Other Sources Report Different Audit Rates?
Because they read the same IRS table at different dates. The GAO reported a 0.25 percent average for tax year 2019 in 2022; the 2025 Data Book shows 0.32 percent for the same year. Both are accurate for their snapshot. This report uses the latest edition throughout and headlines tax year 2021 because its rate is close to final.
| Published figure | Their rate | Same measure, Data Book 2025 | Why they differ |
|---|---|---|---|
| GAO testimony, May 2022: all individual returns, TY 2019 | 0.25% | 0.32% | Earlier snapshot; TY 2019 was still inside the statute |
| GAO testimony, May 2022: $1M under $5M, TY 2019 | 1.02% | 1.76% | Earlier snapshot |
| GAO testimony, May 2022: under $25,000, TY 2019 | 0.40% | 0.44% | Earlier snapshot; little growth at the low end |
| IRS statement, April 2023: $10M or more, TY 2018 | 9.2% | 10.58% | Read from the 2022 Data Book |
| IRS operating plan, 2024: $10M or more, TY 2019 | 11.0% | 11.55% | Read from the 2023 Data Book |
| IRS operating plan, 2024: $10M or more, TY 2010 | 21.5% | 21.48% (2020 edition) | No difference; the year was long closed |
GAO figures are read from Figure 1 of GAO-22-106032, which aggregates some Data Book bands; the $25,000 to $200,000 band it shows at 0.17 percent has no single Data Book equivalent and is omitted. The IRS figures for tax years 2018, 2019, and 2010 reproduce exactly from the 2022, 2023, and 2020 editions respectively, which is how the basis of each was confirmed.
Every competing figure this report found traces to the same source table read at an earlier date, and each one reproduces from the edition current when it was published. That is reassuring about the data, and it is a warning about the way audit statistics are quoted. A figure for a recent tax year should always carry the date of the snapshot. When it does not, the safest assumption is that it understates the final rate, by a little at low incomes and by a great deal at the top.
What Does the $400,000 Audit Pledge Mean for These Numbers?
It cannot be tested from this table. Treasury directed in August 2022 that audit rates for households earning $400,000 or less would not rise above historical levels, later defined by tax year 2018. TIGTA reported that the IRS had not finalized how to measure compliance, and the Data Book income bands do not split at $400,000.
The directive is frequently cited alongside the Data Book, so it is worth being precise about what the table can and cannot say. TIGTA’s 2025 review records that the IRS Commissioner told Congress in April 2023 that the baseline would be the audit coverage rate for tax year 2018, and that TIGTA “cannot definitively say whether the IRS met the 2022 Treasury Directive” without the methodology in place. The Data Book measures total positive income per return, not household income, and its $200,000 to $500,000 band straddles the threshold.
What the table does show is direction. Measured at the same age, tax year 2022 audit rates for every band from $50,000 to $200,000 are below the tax year 2018 rates, while the two lowest bands are higher: under $25,000 at 0.49 percent against 0.42 percent, and $25,000 to $50,000 at 0.28 percent against 0.25 percent. Whether that counts against the directive depends on definitions the IRS has not published, and this report draws no conclusion on it.
What Do These Numbers Not Show?
They do not count IRS matching notices, they do not measure the chance of an audit for any individual, and they do not show what was ultimately assessed. An examination in this table is a formal audit. The far larger volume of automated income matching letters is reported separately and is excluded.
- Matching notices are not audits. The Automated Underreporter Program, which issues proposals such as the CP2000 notice, closed 987,460 cases in fiscal year 2025 with $5.90 billion of additional assessments, according to Table 3-8 of the same Data Book. That is roughly twice the 497,621 examinations of all return types closed that year, and none of it appears in the audit rates above.
- Income band is not risk. The IRS selects returns on the content of the return, not the band. A return with a large Schedule C loss, a high credit claim, or unreported information returns carries different odds from its band average.
- Total positive income ignores losses. A taxpayer with $3 million of capital gains and $2.5 million of losses sits in the $1 million to $5 million band even though adjusted gross income is far lower.
- Related returns are counted once per tax year and form type. The IRS counts a distinct taxpayer by tax year and form, so an audit that reaches back to several years appears in each year’s column.
The first point is the one most often missed. Many taxpayers who say they were audited received a matching notice proposing a change based on a Form 1099 or W-2 the return did not reflect. Those letters are common, they are handled differently, and they are not in this report’s numbers.
What Should You Do If an IRS Audit Letter Arrives?
The data points to four practical conclusions. First, the type of contact matters more than the income band: a correspondence audit asking for documents on one credit or deduction is a different exercise from a field examination of a business or an investment structure, and the response should be built for the specific issue. Second, a reply should never be skipped. The non-response figures reported by the Taxpayer Advocate show how often low income audits end in default, and default generally means an assessment followed by collection. Third, an adjustment often carries more than the tax itself, because an understatement found on examination can draw the 20 percent accuracy-related penalty under section 6662. Fourth, the timeline is long at the top. The Taxpayer Advocate’s figures show examinations of $10 million returns averaging 544 days to completion in fiscal year 2025, so high income taxpayers should expect an examination opened on a recent year to run well into a second calendar year. In complex field examinations the IRS can also compel records from the taxpayer or third parties through an IRS summons.
Records are the common thread. An examination asks a taxpayer to substantiate what the return reports, which is far easier while the records are current than two or three years later when the letter arrives. Keeping the support for every deduction, credit, basis figure, and business expense for at least as long as the statute runs is the single most protective habit the data supports. For the year that is already under examination, our IRS resolution and audit support page explains how the firm approaches representation.
How Was This Report Prepared?
Methodology. Tax Expert Today extracted the individual income tax return rows from six consecutive editions of the IRS Data Book examination coverage table: Table 17 in the 2020, 2021, 2022, 2023 (revised), and 2024 editions and Table 3-1 in the 2025 edition, each covering nine tax years. The table number history was read from each file’s own caption. For every income band and tax year the audit rate was recomputed as examinations closed plus examinations in process, divided by returns filed, which is the definition in footnote 4 of the table, and compared with the percentage the IRS publishes. In the 2025 edition every recomputed rate matches the published percentage. In nine earlier edition cells, all in the top two bands for tax years 2014 to 2018, the counts and the published percentage differ because the IRS shows prior year counts for disclosure reasons; in those cells the published percentage is used. Every 2025 count for returns filed, closed, and in process was then checked against the typeset table in the printed Data Book PDF: all 377 matched, nine of them as asterisked prior year values, none in tax year 2021. Returns filed for each tax year are identical across all six editions, as the IRS footnote indicates they should be.
Snapshot age is the number of fiscal years between the end of the tax year and the edition, so tax year 2021 in the 2024 edition has an age of three. Same age comparisons use only rates measured at the same age. Eight figures that other bodies have published were reproduced from the matching editions as anchors, including the IRS’s own 6.6, 3.9, and 0.9 percent tax year 2021 rates and its pooled 7.9 percent rate for $10 million returns across tax years 2015 to 2023. A corroboration sweep covered the GAO, three TIGTA reports, the National Taxpayer Advocate 2025 Annual Report to Congress, the IRS Strategic Operating Plan, and the IRS’s own statements; every divergent figure found traces to an earlier snapshot of the same table and is disclosed above. Only a handful of sources publish this series across editions. All source files, extraction scripts, and a workpaper mapping every published figure to its source and calculation are retained and available on request. The full six edition dataset is downloadable as a machine readable file: tet-irs-audit-rates-by-income-ty2010-2023.csv. The data may be reused with attribution to Tax Expert Today LLC.
IRS Audit Help Naples: Local Representation
Tax Expert Today LLC represents individuals and businesses in Naples, Florida and across Southwest Florida through IRS examinations of every kind, from a single issue correspondence audit to a multi year field examination of a business or investment structure. The firm is multidisciplinary, with enrolled agents, CPAs, and attorneys, and represents taxpayers before the IRS nationwide. Collier County households report some of the highest incomes in the country, which places many of them in the income bands where this report shows audit odds rising fastest. The office is at 11983 Tamiami Trail N, Naples, FL 34110, and the team can be reached at (239) 441-2005, Monday through Friday, 10am to 5pm ET. Our dedicated page on IRS audit help in Naples, FL describes the process, and our Naples tax resolution page covers what follows when an audit ends in a balance the taxpayer cannot pay at once.
Frequently Asked Questions
What percentage of tax returns does the IRS audit?
For tax year 2021, the most recent year outside the normal three year statute, the IRS had examined 0.32 percent of individual income tax returns as of September 30, 2025, about 1 in 316. That covers 510,375 examinations of 161,206,833 returns. The rate for tax year 2015 was 0.58 percent and for tax year 2010 was 1.01 percent.
Which income group has the highest audit rate?
Returns reporting $10 million or more of total positive income, which the IRS examined at 6.59 percent for tax year 2021, about 1 in 15. Returns of $5 million to $10 million were examined at 3.86 percent. Below $1 million, the highest rate belongs to returns under $25,000, at 0.51 percent, largely because of Earned Income Tax Credit audits.
Why are low income taxpayers audited more than middle income taxpayers?
Mainly because of the Earned Income Tax Credit. Returns claiming it were 20.0 percent of tax year 2021 returns but 43.9 percent of individual examinations. IRS officials told the GAO that EITC audits are limited in scope and that the credit historically has high improper payment rates. Most of these audits are conducted by mail.
Why do recent tax years show such low audit rates?
Because the IRS can open audits for at least three years after a return is filed, so recent tax years are still accumulating examinations. For returns of $10 million or more, tax year 2019 showed 2.01 percent two years after the tax year and 11.55 percent in the 2025 Data Book. Recent rates should always be read with the date of the snapshot.
Is a CP2000 notice an audit?
Not in the IRS audit statistics. A CP2000 is an Automated Underreporter proposal based on information returns, and the program is reported separately in Table 3-8 of the Data Book, which shows 987,460 cases closed in fiscal year 2025. The audit rates in this report count formal examinations only, and a CP2000 still needs a timely response.
Where can I get help with an IRS audit in Naples, Florida?
Tax Expert Today LLC, located at 11983 Tamiami Trail N, Naples, FL 34110, represents taxpayers in Naples and across Southwest Florida in IRS correspondence and field examinations. The firm is multidisciplinary, with enrolled agents, CPAs, and attorneys, and represents clients before the IRS nationwide. Consultations can be arranged at (239) 441-2005.
When to Engage a Professional About an IRS Audit
A short correspondence audit asking for a single document can often be answered directly, provided the answer is complete and arrives on time. Professional representation earns its place when the examination is a field or office audit, when it reaches more than one tax year, when it involves a business, a partnership interest, or an investment structure, when the IRS has already proposed a deficiency, or when the response deadline has passed. The data in this report shows why the stakes rise with income: the average recommended additional tax per closed examination of a $1 million to $5 million return was $42,933 for tax year 2021, and $175,231 at $10 million or more. Representation also changes the mechanics, because an authorized representative can take the examiner’s calls, manage document requests, and frame the issues before positions harden. Tax Expert Today LLC represents individuals and businesses before the IRS nationwide, and Dr. Kabashi, the firm’s founder, leads the practice. Our companion research on the IRS offer in compromise acceptance rate, on IRS civil penalties assessed and abated, and on Florida wealth migration applies the same method to other IRS data.
Call (239) 441-2005 or schedule a consultation to review an audit letter or an open examination. Tax advisors, enrolled agents, CPAs, and attorneys serving clients in all 50 states.
Published October 2, 2026 by Dr. Pellumb Kabashi « Back to Learning Center
Have a question this article touches on?
Tax Expert Today LLC, based in Naples, Florida and serving clients across the United States.
Schedule a Consultation (239) 441-2005