
By Dr. Pellumb Kabashi, DBA, MBA, CES, CFE, EA
Founder, Tax Expert Today LLC · Tax advisors, enrolled agents, CPAs, and attorneys · Serving clients in all 50 states
Quick Answer: How to improve gross margin comes down to four levers worked in order of speed: price, direct cost, mix, and waste. Price moves first because the arithmetic is forgiving. A business running a 30 percent gross margin can raise prices 10 percent and still finish ahead after losing up to 25 percent of unit volume. Measure margin by line, never in total. Call (239) 441-2005 for a free consultation.
Most guidance on how to improve gross margin stops at a list of suggestions. Raise prices. Negotiate with suppliers. Sell more of the profitable things. All of that is true, and none of it tells an owner the one thing that actually governs the decision, which is how much room the arithmetic gives before a change stops being worth making.
That number is knowable. It takes about a minute to calculate, it is different for every business, and it is frequently the difference between a price increase that owners are too nervous to attempt and one they make on a Monday morning. This guide works through the math behind each lever, then covers the part almost no margin article addresses at all, which is what a margin decision does to the tax return.
What Is Gross Margin, and Why Does It Decide Everything Downstream?
Gross margin is revenue minus the direct cost of delivering that revenue, expressed as a percentage of revenue. It matters more than net margin for decision making because it is the only profit measure that scales cleanly with volume. Every dollar of gross margin flows toward fixed costs first, then to profit, which makes it the number that decides whether growth helps or hurts.
- The formula: revenue minus cost of goods sold, divided by revenue. IRS Publication 334 walks through the gross profit computation for a small business return.
- Direct cost means traceable cost: materials, direct labor, subcontractors, freight, merchant fees, and anything else that would disappear if the sale did not happen.
- Fixed cost stays out of it: rent, administrative salaries, insurance, and software belong below the gross margin line, not inside it.
- It is the leverage point: a business with a 20 percent gross margin needs five dollars of new revenue to cover one dollar of new overhead. At 50 percent it needs two.
- Low margin plus growth is a cash trap: growing a thin margin business consumes working capital faster than it generates profit, which is why margin work usually has to precede growth work.
That last point is the reason margin sits ahead of almost everything else in an advisory conversation. An owner who grows a 15 percent gross margin business by 40 percent has taken on 40 percent more delivery risk, 40 percent more payroll, and 40 percent more receivables, in exchange for a slice of profit so thin that a single bad quarter erases it. The same effort spent moving margin from 15 percent to 20 percent produces more profit with no additional volume, no additional headcount, and no additional working capital.
How to Improve Gross Margin: Which Lever Should Move First?
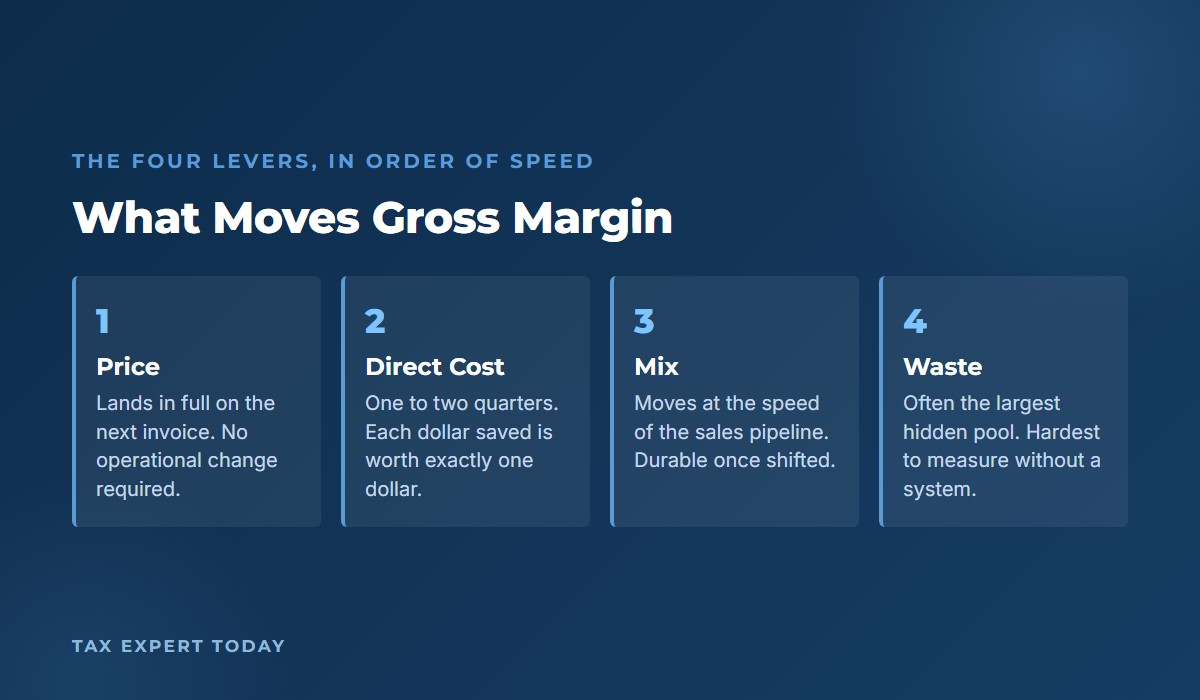
Work four levers in a deliberate order: price, direct cost, mix, and waste. Price is first because it reaches the bottom line immediately and requires no operational change. Direct cost is second, mix is third because it takes a sales cycle to shift, and waste is last because it is the slowest to move and the easiest to over-engineer.
- Price: the only lever where the entire change lands in gross margin. A 5 percent price increase with no cost change is 5 points of revenue converted to pure margin.
- Direct cost: supplier terms, material substitution, labor efficiency, and freight. Real, but each dollar saved is worth exactly one dollar, and it usually takes negotiation.
- Mix: shifting volume toward the higher margin lines. Powerful and durable, but it moves at the speed of the sales pipeline.
- Waste: rework, shrinkage, unbilled hours, and scope delivered but never invoiced. Often the largest hidden pool, and the hardest to measure without a system.
| Lever | Speed to impact | What one point of margin requires | Main risk |
|---|---|---|---|
| Price | Immediate, next invoice | Roughly a 1 percent price increase | Volume loss, which is measurable in advance |
| Direct cost | One to two quarters | Roughly a 1.5 to 2 percent reduction in delivered cost | Quality or reliability slipping with a cheaper input |
| Mix | Two to four quarters | A measurable shift of volume into higher margin lines | Capacity constraints in the line you are growing |
| Waste | Two to four quarters | Capturing work already performed but not billed | Measurement cost exceeding the recovery |
The ordering is not arbitrary. Price is the only lever that requires nothing from operations, nothing from suppliers, and nothing from the sales pipeline. It can be decided on a Tuesday and be in effect on a Wednesday. Every other lever needs somebody to change how they work.
How Much Volume Can You Afford to Lose After a Price Increase?
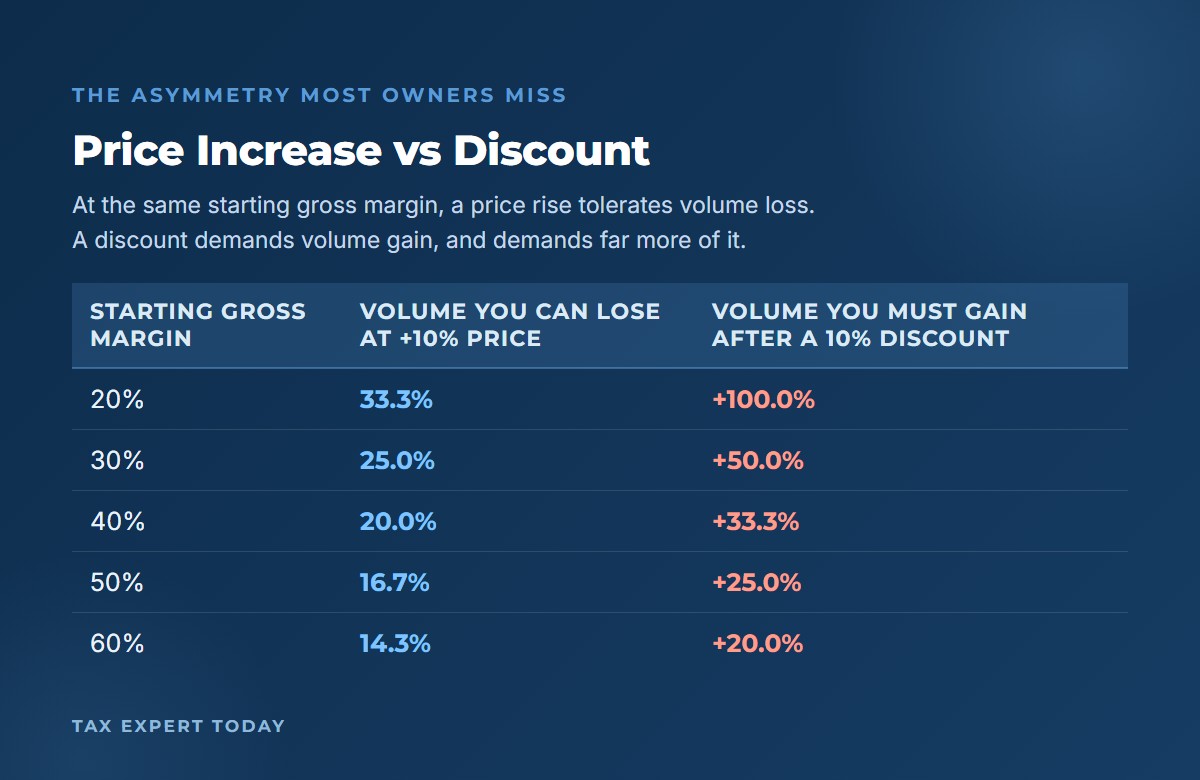
The breakeven volume loss equals the price increase divided by the sum of the current gross margin and the price increase. At a 30 percent gross margin, a 10 percent price increase can absorb a 25 percent loss of unit volume before gross profit falls. Lower margin businesses can absorb more volume loss, not less, which is the opposite of what most owners assume.
- The formula: breakeven volume loss = price increase percent divided by (gross margin percent plus price increase percent).
- Thin margins are more forgiving on price: at 20 percent margin a 10 percent increase tolerates a 33.3 percent volume loss.
- Rich margins are less forgiving: at 60 percent margin the same increase tolerates only 14.3 percent.
- Actual losses are usually far smaller: most businesses lose a low single digit percentage of volume on a modest increase, well inside these thresholds.
- Run it per line: the number differs by product and service line because the starting margin differs.
| Current gross margin | Volume you can lose at +3% | At +5% | At +10% |
|---|---|---|---|
| 20% | 13.0% | 20.0% | 33.3% |
| 30% | 9.1% | 14.3% | 25.0% |
| 40% | 7.0% | 11.1% | 20.0% |
| 50% | 5.7% | 9.1% | 16.7% |
| 60% | 4.8% | 7.7% | 14.3% |
Read the 30 percent row carefully, because it reframes the decision. An owner debating a 10 percent increase is usually asking whether customers will accept it. The better question is whether more than a quarter of them will leave, because anything short of that leaves the business with more gross profit than it started with, delivered on less volume, using less capacity, and carrying less receivable risk.
These figures are illustrative and assume direct cost per unit holds steady as volume changes. Where volume declines free up capacity that carries real cost, or where a supplier discount is tied to volume tiers, the thresholds shift and the analysis should be run on actual numbers.
What Does a Discount Actually Cost in Gross Margin?
A discount is a price decrease, so the same formula runs in reverse and the results are severe. At a 30 percent gross margin, a 10 percent discount requires a 50 percent increase in volume simply to break even. At a 20 percent margin, the same discount requires doubling volume. Discounting is the most expensive growth tactic available to a small business.
- The formula: required volume increase = discount percent divided by (gross margin percent minus discount percent).
- Below the margin line it becomes impossible: a 15 percent discount on a 15 percent margin gives away the entire gross profit at any volume.
- Small habitual discounts compound: an average 8 percent discount across a hypothetical $2,400,000 of list revenue removes $192,000 of gross margin in a year.
- Discretionary discounts are the leak: approved exceptions granted at the point of sale rarely appear in any report.
- Measure the realized price: the gap between list and invoiced price is the number to track, not the discount policy on paper.
| Current gross margin | Volume needed after a 5% discount | After 10% | After 15% |
|---|---|---|---|
| 20% | +33.3% | +100.0% | +300.0% |
| 30% | +20.0% | +50.0% | +100.0% |
| 40% | +14.3% | +33.3% | +60.0% |
| 50% | +11.1% | +25.0% | +42.9% |
| 60% | +9.1% | +20.0% | +33.3% |
The asymmetry between this table and the previous one is the single most useful thing in this guide. A 10 percent price increase at a 30 percent margin survives a 25 percent volume loss. A 10 percent discount at that same margin demands a 50 percent volume gain. The upside case tolerates a quarter of the customer base walking away; the downside case requires finding half again as much business. Yet the discount is the move owners make casually, and the increase is the one they postpone for years.
How Do You Find Which Line Is Leaking Profit?
Split revenue into product or service lines, assign only traceable direct cost to each, and compute margin per line. Total gross margin is an average that conceals its own components. In most owner-operated businesses the largest revenue line is not the most profitable one, and the smallest line is frequently destroying margin outright.
- Four to eight lines is the right granularity: fewer hides the problem, more creates allocation arguments that never resolve.
- Assign only traceable cost: resist allocating overhead, which turns the analysis into a debate about the allocation method.
- Rank by margin percent and by gross profit dollars: the two rankings answer different questions.
- Look at the revenue share alongside it: a low margin line consuming 40 percent of capacity is a structural problem, not a rounding error.
- Rebuild it quarterly: mix drifts, and the line that was healthy last year may not be now.
Consider a hypothetical Southwest Florida services business with $2,400,000 of annual revenue across four lines. The consolidated gross margin is 34 percent, a figure that looks unremarkable and prompts no action. The line detail tells a different story.
| Service line | Revenue | Direct cost | Gross profit | Gross margin | Share of revenue |
|---|---|---|---|---|---|
| Recurring monthly service | $960,000 | $624,000 | $336,000 | 35.0% | 40% |
| Project and implementation | $720,000 | $540,000 | $180,000 | 25.0% | 30% |
| Advisory retainer | $480,000 | $206,400 | $273,600 | 57.0% | 20% |
| One-off support calls | $240,000 | $213,600 | $26,400 | 11.0% | 10% |
| Total | $2,400,000 | $1,584,000 | $816,000 | 34.0% | 100% |
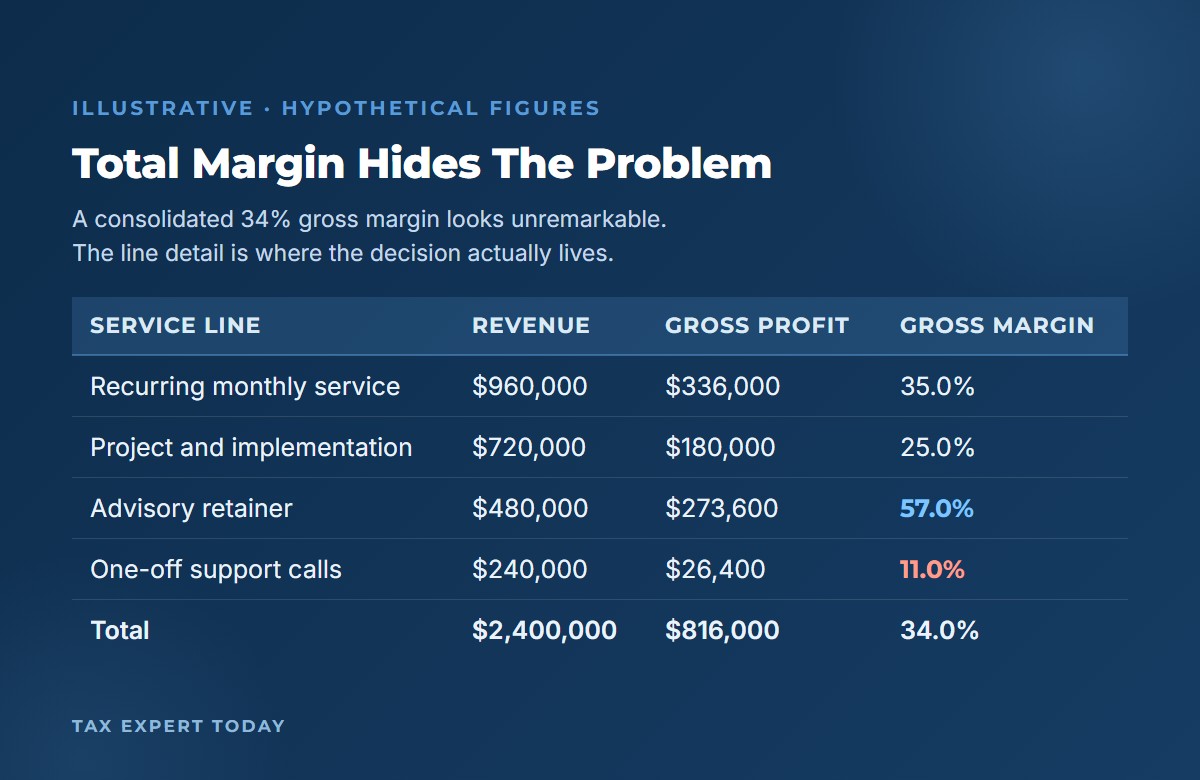
Three findings fall out of a table that took an afternoon to build. The advisory retainer produces a 57 percent margin on a fifth of the revenue, and it is the line the business should be selling hardest. Project work carries 30 percent of revenue at 25 percent margin, which is respectable but dilutive. And one-off support calls consume 10 percent of revenue and capacity to produce 11 percent margin, contributing $26,400 of gross profit for a full year of interruption.
Now apply the breakeven arithmetic to that last line. At an 11 percent gross margin, a 10 percent price increase can absorb a 47.6 percent volume loss before gross profit declines. Suppose the business raises the price of one-off support by 10 percent and loses a quarter of that volume. Revenue on the line falls from $240,000 to $198,000, direct cost falls from $213,600 to $160,200, and gross profit rises from $26,400 to $37,800. The business earned roughly 43 percent more gross profit on 17.5 percent less revenue, and freed capacity in the process. These figures are hypothetical and are used to illustrate the mechanism.
Where Do Profit Leaks Hide in an Owner-Operated Business?
The recurring leaks are unpriced scope, legacy customers on old rates, undisciplined discounting, and work performed but never invoiced. None appears as a line item in any financial statement, because each one shows up as revenue that was never recorded rather than as cost that was. That is precisely why they persist.
- Scope creep: additional work absorbed into a fixed fee because raising it felt awkward. Cost is incurred, revenue is not.
- Legacy pricing: long-tenured customers still paying rates set years ago while delivery cost rose every year since.
- Discretionary discounting: concessions granted at the point of sale that no report aggregates.
- Unbilled time and materials: hours worked, trips made, and materials consumed that never reach an invoice.
- Rework and warranty: the second delivery of something already paid for once, carrying full cost and zero revenue.
| Leak | How to detect it | Usual fix |
|---|---|---|
| Scope creep | Compare hours or units delivered against what the fee assumed | Written change orders, and a scope boundary in the engagement terms |
| Legacy pricing | Sort the customer list by the date the rate was last changed | A scheduled annual review applied to everyone, not case by case |
| Discretionary discounting | Track realized price against list price by salesperson and by customer | An approval threshold, and reporting that makes the pattern visible |
| Unbilled work | Reconcile time and material records against invoices issued | Close the billing cycle against delivery records, not memory |
| Rework | Track second visits and returns as their own cost category | Address the root cause, and price the risk into the original quote |
Legacy pricing deserves particular attention because it compounds silently. A customer signed at a rate set four years ago, in a business whose delivery costs have risen since, may now be served at a margin the owner would decline if quoted fresh today. The fix is structural rather than confrontational: an annual review applied uniformly to the whole customer base is a policy, whereas a rate increase applied to one customer is a negotiation.
When Should You Stop Serving a Customer?
Consider ending a relationship when the account produces gross margin materially below the business average, has declined a price correction, and consumes capacity that a better margin line could use. The test is not whether the customer is profitable in isolation. It is whether the capacity they occupy would earn more deployed elsewhere.
- Measure margin at the account level: revenue less traceable delivery cost, for that customer specifically.
- Offer the correction first: a rate adjustment is the outcome to aim for, and many accounts accept it.
- Check the capacity question: exiting only helps if the freed capacity has somewhere better to go, or if the cost released is genuinely variable.
- Account for concentration risk: exiting a large account changes the risk profile of the whole business, not just its margin.
- Watch for the hidden costs: accounts that consume disproportionate administrative attention cost more than the delivery ledger shows.
The capacity condition is the one most often skipped. Releasing a low margin account is only an improvement if the resources it occupied either go to better work or genuinely leave the cost base. Where a business exits an account and retains the same payroll with nothing to fill the gap, total gross profit falls even though the average margin percentage improves. Average margin is a ratio, and a ratio can be made to look better by shrinking, which is why gross profit dollars have to be checked alongside it.
How Do Margin Decisions Change Your Tax Position?
Margin improvement increases taxable income, so the decision and its tax treatment are most usefully planned together. The choices that matter most are the inventory accounting method under Section 471(c), whether uniform capitalization under Section 263A applies, and where the resulting income lands relative to the Section 199A qualified business income thresholds.
- The gross receipts gate: for tax years beginning in 2026 the Section 448(c) test is met if average annual gross receipts for the prior three-year period do not exceed $32,000,000, confirmed in Rev. Proc. 2025-32.
- Inventory simplification: Section 471(c) allows a qualifying small business taxpayer to avoid the general inventory rules, which changes when direct cost becomes deductible.
- UNICAP relief: Section 263A otherwise requires capitalizing direct and certain indirect costs into inventory rather than deducting them currently.
- The QBI thresholds: for 2026 the Section 199A threshold amount is $403,500 for joint returns and $201,750 for all other returns, per Rev. Proc. 2025-32.
- Timing is a lever: whether a price increase takes effect in December or January moves income between tax years, which may matter where a threshold is nearby.
| Margin decision | Tax dimension to check | Authority |
|---|---|---|
| Buying materials earlier to secure a lower unit cost | Whether the cost is currently deductible or must be capitalized into inventory | Sections 471 and 263A; Pub 538 |
| Changing how inventory or direct cost is accounted for | A method change generally requires filing Form 3115 | Section 446(e) |
| A price increase that lifts taxable income | Position relative to the Section 199A threshold and phase-in range | Section 199A |
| Exiting a low margin line and releasing assets | Depreciation recapture on any equipment disposed of | Sections 1245 and 1250 |
| Shifting owner compensation as profit rises | Reasonable compensation, and the interaction with the QBI calculation | Section 162; Section 199A |
The point is not that tax considerations should govern a margin decision. A pricing change that is right for the business is generally right regardless of its tax treatment. The point is that the two decisions are usually made months apart by different people, and the sequencing costs money that better coordination would have kept. An owner who improves gross profit substantially and discovers the consequences at filing time had the information to plan for it and simply was not asked the question at the right moment.
Whether any of these provisions applies depends on entity type, gross receipts history, the nature of the business, and facts specific to the taxpayer. Our Naples tax planning overview and our tax planning services cover how those pieces fit together, and the depreciation side of an equipment decision is covered in our guide to cost segregation studies.
How Does Margin Work Fit With the Rest of the CFO Cadence?
Margin analysis is a quarterly discipline that sits between the weekly cash forecast and the annual plan. The cash forecast tells an owner whether the business can pay for what it already committed to. The margin review tells them whether what they are selling is worth selling. Both are needed, and each answers a question the other cannot.
- Weekly: the cash view, covered in our guide to the 13 week cash flow forecast.
- Monthly: the close and the management package, so line-level margin is actually measurable.
- Quarterly: the margin and pricing review described in this guide.
- Annually: the plan, the capital budget, and the tax position that follows from all of it.
A quarterly slot on the calendar is what turns how to improve gross margin from a recurring topic of conversation into a decision with a date attached. Owners weighing how to resource this work may find our comparison of fractional CFO cost against a full-time hire useful, and our walkthrough of what a fractional CFO actually does month to month shows where the margin review fits in the wider operating rhythm.
Gross Margin Improvement Naples: Help in Southwest Florida
Seasonality gives this work a particular shape in Southwest Florida. Businesses serving construction, hospitality, marine services, property management, and professional services here often deliver a disproportionate share of annual revenue in a compressed season. For owners here, how to improve gross margin is usually settled by the rate set before the season opens rather than by anything done during it. That concentration makes pricing decisions higher stakes, because a rate set going into the season governs the majority of the year’s gross profit, and it makes discounting more damaging, since capacity given away at a discount during peak weeks cannot be recovered in the quiet months.
Tax Expert Today LLC works with owners on building the line-level margin view, testing pricing changes against the breakeven arithmetic before they are made, and planning the tax consequences of the resulting income in the same conversation. Our team includes tax advisors, enrolled agents, CPAs, and attorneys, which means the pricing discussion and the tax discussion happen together rather than in separate rooms months apart.
Our office is at 11983 Tamiami Trail N, Naples, Florida 34110. Call (239) 441-2005, Monday through Friday, 10:00am to 5:00pm ET. We serve clients in Naples, Bonita Springs, Estero, Fort Myers, Marco Island, and throughout Florida and all 50 states. Ongoing financial oversight is available through our fractional CFO services and our business consulting practice.
Does a seasonal Southwest Florida business need a different approach to pricing? The arithmetic does not change, but the timing does. A seasonal business gets one meaningful opportunity a year to reset rates, which is ahead of the season rather than during it. Running the line-level margin review in the quiet months, so the pricing decision is ready before demand arrives, tends to matter more here than in a business with level demand across twelve months.
When to Engage a Professional
Margin work benefits from an outside view at a few specific points. Consider engaging a professional when how to improve gross margin has become a live question but the line-level picture has never been built and the business has more than a handful of revenue streams; when a price increase is under consideration and the breakeven threshold has not been calculated; when improved profitability is likely to move taxable income across a threshold that changes the tax outcome; or when an inventory or accounting method question arises, since a method change generally requires a filing rather than a decision.
Tax outcomes depend on individual facts and circumstances, and nothing here should be treated as advice for a specific situation. This guide describes mechanisms and the arithmetic behind them so that owners can ask better questions. Call (239) 441-2005 or visit our fractional CFO services page to discuss how the margin review and the tax plan can be coordinated. Engagement scope and pricing are determined after a consultation.
Frequently Asked Questions
What is the difference between gross margin and net margin? Gross margin measures revenue less the direct cost of delivering it. Net margin subtracts everything else as well, including overhead, interest, and taxes. Gross margin is the better decision-making tool because it isolates the economics of the sale itself, without fixed costs that do not change with volume obscuring the picture.
Is there a good gross margin percentage to aim for? There is no universal target, because the figure varies enormously by industry and business model. A distributor may operate healthily in the teens while a professional services firm may need fifty percent or more to cover its overhead. The more useful benchmark is the business’s own trend over time and the spread between its own lines.
Should prices be raised across the board or selectively? Selectively, in most cases. The breakeven threshold differs by line because the starting margin differs by line, and the lowest margin lines can generally absorb the largest volume loss. A uniform increase applies the same change to lines with very different tolerances for it.
How often should the margin review be run? Quarterly is sufficient for most owner-operated businesses. Mix drifts gradually, and a quarterly cadence catches the drift while leaving enough time between reviews for changes to show an effect. Businesses with volatile input costs may benefit from reviewing the direct cost side more frequently.
Does improving gross margin increase the tax bill? Generally yes, since improved gross profit increases taxable income, all else equal. That is not a reason to avoid the improvement. It is a reason to plan the timing and the accounting method alongside the pricing decision rather than discovering the consequence after the year has closed.
Published August 8, 2026 by Dr. Pellumb Kabashi « Back to Learning Center
Have a question this article touches on?
Tax Expert Today LLC, based in Naples, Florida and serving clients across the United States.
Schedule a Consultation (239) 441-2005