
By Dr. Pellumb Kabashi, DBA, MBA, CES, CFE, EA
Founder, Tax Expert Today LLC · Tax advisors, enrolled agents, CPAs, and attorneys · Serving clients in all 50 states
Quick Answer: A 13 week cash flow forecast projects cash receipts and cash disbursements week by week across one quarter using the direct method, so an owner sees a shortfall while there is still time to act on it. It tracks money actually moving through the bank account rather than accrual revenue. Rebuilt every week, it commonly surfaces a gap eight to ten weeks before the bank balance shows it. Call (239) 441-2005 for a free consultation.
What Is a 13 Week Cash Flow Forecast?
A 13 week cash flow forecast is a rolling schedule that lists every dollar expected to enter and leave the bank account in each of the next 13 weeks, then carries the ending balance of one week into the next. It uses the direct method, meaning it forecasts actual receipts and payments rather than adjusting net income. Thirteen weeks covers exactly one fiscal quarter at weekly resolution.
The distinction that matters most is that the forecast is not a profit projection. A business can be profitable on paper for a quarter and still miss a payroll, because revenue is recognized when it is earned while cash arrives when the customer actually pays. IRS Publication 334 describes the accrual and cash accounting methods, and the gap between them is precisely the space where a cash crisis hides. The forecast closes that gap by ignoring accruals entirely and modeling the bank account.
Three properties define the tool. It is direct, built from receipts and disbursements rather than from net income. It is rolling, so each week that closes drops off the front and a new thirteenth week is added to the back, keeping the horizon constant. And it is short, which is what makes weekly precision achievable in the first place.
Why 13 Weeks Instead of a Monthly Budget?
Thirteen weeks is long enough to capture a full quarterly cycle of payroll runs, rent, insurance, debt service, and tax payments, yet short enough that the individual line items can be estimated with real confidence. A monthly budget hides the timing problem. It shows a month in which receipts exceed disbursements while concealing the fact that the disbursements land in week one and the receipts arrive in week four.
That timing blindness is the whole issue. Payroll does not wait for a customer to pay an invoice. In a business with biweekly payroll, a monthly view averages two payroll runs across four weeks, which makes the cash requirement look smooth when it is actually lumpy. The weekly view exposes the lump, and the lump is what causes the overdraft.
The horizon also matters for the decisions it enables. A gap identified two weeks out leaves almost no options beyond an emergency draw or a missed payment. The same gap identified eight to ten weeks out leaves room to accelerate collections, reschedule a discretionary purchase, negotiate vendor terms, or arrange financing on ordinary rather than distressed terms. The forecast buys time, and time is what converts a crisis into a decision.
How Do You Build a 13 Week Cash Flow Forecast, Step by Step?
Building the forecast takes six steps: establish the true opening cash balance, lay out the weekly grid, forecast receipts from the receivables aging rather than from the sales plan, schedule every committed disbursement including tax payments, compute the weekly net and running balance, then set a minimum operating floor against which the balance is tested.
Step one, establish the opening balance. Start with the actual bank balance, not the book balance. Subtract checks written but not yet cleared and add deposits in transit. The forecast is worthless if week one starts from a number that the bank does not agree with.
Step two, lay out the grid. Thirteen columns, one per week, each anchored to a specific week ending date. Anchoring to real dates rather than to abstract week numbers is what allows fixed obligations to be placed accurately.
Step three, forecast receipts from the aging. This is where most forecasts fail. Receipts should be built from the accounts receivable aging schedule, invoice by invoice, using each customer’s demonstrated payment behavior, not from the sales forecast. A customer who has paid on day 52 for the last six invoices should be modeled at day 52 regardless of the stated 30 day terms.
Step four, schedule the disbursements. Fixed and committed items are placed on their known dates. Payroll, rent, debt service, insurance, and tax payments are all known in advance and belong on the calendar before any discretionary spending is considered. The tax rows are covered in the next section, because they are the rows most often left out.
Step five, compute net and the running balance. Receipts less disbursements gives the weekly net. The prior week’s ending balance plus this week’s net gives this week’s ending balance. That running balance is the output the entire exercise exists to produce.
Step six, set the floor. Define the minimum cash balance the business must hold, then read the forecast against that floor rather than against zero. Running out of cash is not the trigger. Dropping below the level at which the business can absorb one late payment is the trigger.
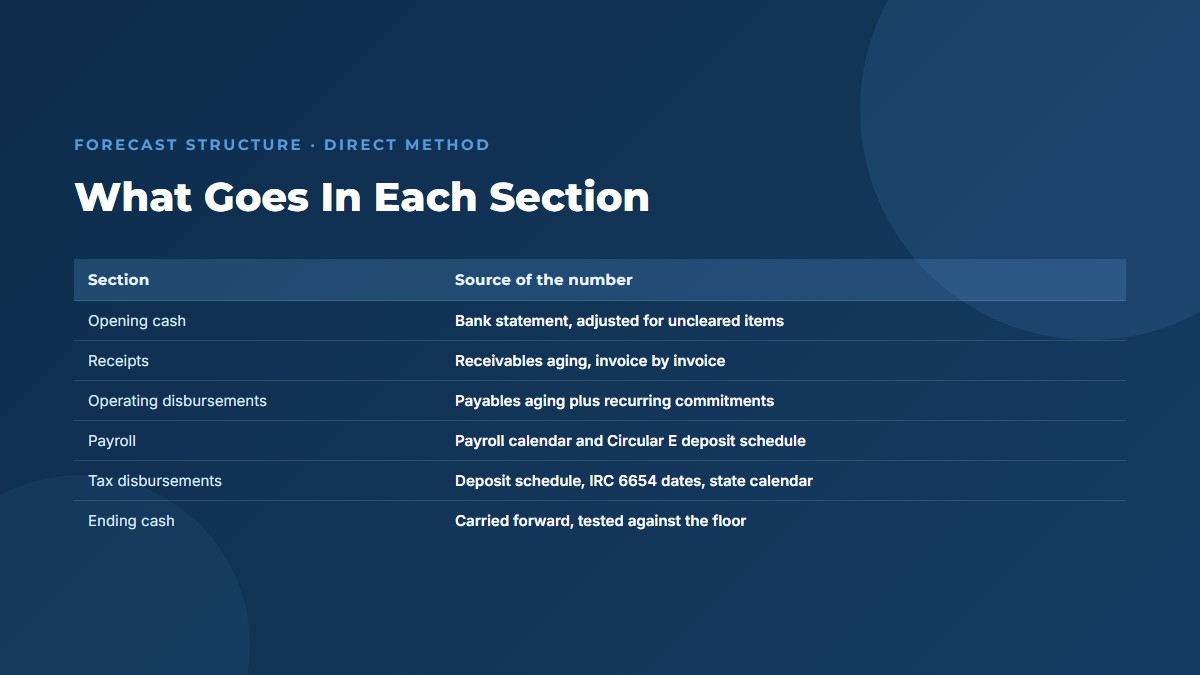
| Section | Typical line items | Where the number comes from |
|---|---|---|
| Opening cash | Bank balance, adjusted for uncleared items | Bank statement, not the general ledger |
| Receipts | Customer collections, deposits, loan proceeds, tax refunds, owner contributions | Accounts receivable aging by invoice and customer payment history |
| Operating disbursements | Vendor payments, subcontractors, materials, utilities, software, fuel | Accounts payable aging plus recurring commitments |
| Payroll disbursements | Net payroll, employer payroll taxes, benefits, retirement contributions | The payroll calendar and the deposit schedule in Circular E |
| Tax disbursements | Federal payroll tax deposits, estimated income tax, sales and use tax | Deposit schedule, IRC Section 6654 dates, state remittance calendar |
| Financing and fixed | Rent, debt service, equipment leases, insurance premiums | Loan amortization schedules and executed contracts |
| Net and ending cash | Receipts less disbursements, carried forward | Calculated, then tested against the minimum floor |
Which Tax Payments Belong in the Forecast?
Three categories of tax payment belong on the disbursement schedule, and they are the lines most often omitted: federal employment tax deposits on the employer’s assigned schedule, quarterly estimated income tax installments, and state sales and use tax remittances. Each has a statutory due date that does not move for a business’s cash convenience, and each carries a penalty for lateness.
This is where a general cash flow template built for a treasury department tends to fail an owner-operated business. The template models payroll but treats the associated tax deposit as an afterthought, and it usually ignores the owner’s estimated tax payments entirely even though those payments come out of the same bank account.
Federal employment tax deposits. Under Publication 15 (Circular E) for 2026, an employer’s deposit schedule for a calendar year is determined by the total taxes reported in a four quarter lookback period that begins July 1 and ends June 30. An employer who reported $50,000 or less for the lookback period is a monthly schedule depositor. An employer who reported more than $50,000 is a semiweekly schedule depositor. For semiweekly depositors, employment taxes for wages paid on Wednesday, Thursday, or Friday are deposited by the following Wednesday, and taxes for wages paid on Saturday, Sunday, Monday, or Tuesday are deposited by the following Friday. Separately, an employer who accumulates $100,000 or more in taxes on any day during a deposit period must deposit by the next business day regardless of which schedule otherwise applies.
The forecasting consequence is easy to miss. For a semiweekly depositor, the deposit generally lands in a different week than the payroll that generated it. A forecast that places the deposit in the same week as the payroll will be wrong on both weeks, and the error repeats every pay cycle.
Quarterly estimated income tax. IRC Section 6654 sets four required installments with due dates of April 15, June 15, September 15, and January 15 of the following year. For a pass-through owner, these installments are personal payments that nevertheless often originate from a distribution out of the business, which means they belong in the business forecast as the distribution that funds them. The required annual payment is generally the lesser of 90 percent of the current year tax or 100 percent of the prior year tax, and that second figure becomes 110 percent where prior year adjusted gross income exceeded $150,000, or $75,000 for a married individual filing separately.
State sales and use tax. For a Florida business, the Florida Department of Revenue provides that sales and use tax returns and payments are due on the 1st and late after the 20th day of the month following each reporting period. Sales tax collected is not revenue and never was. It is money held on behalf of the state, and a forecast that leaves it in the operating balance overstates available cash every month until the remittance clears.
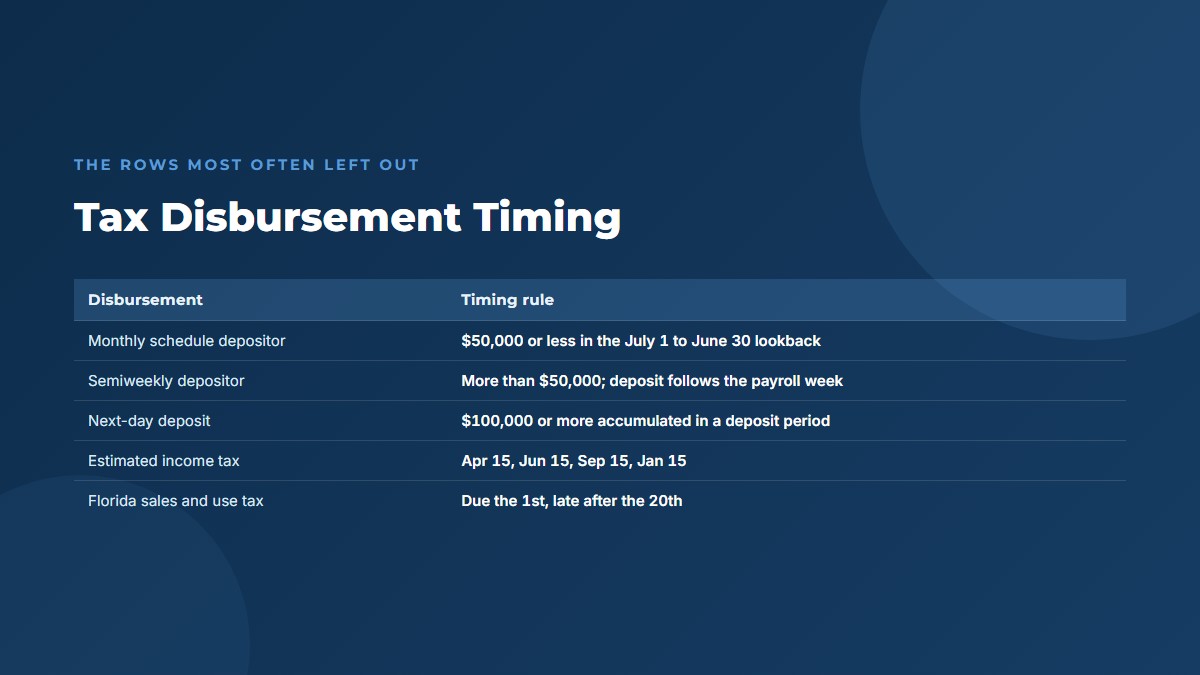
| Tax disbursement | Timing rule | Authority |
|---|---|---|
| Employment taxes, monthly schedule depositor | Reported $50,000 or less in the July 1 to June 30 lookback period | Publication 15 (2026) |
| Employment taxes, semiweekly schedule depositor | Reported more than $50,000 in the lookback period; wages paid Wednesday through Friday deposit by the following Wednesday, wages paid Saturday through Tuesday deposit by the following Friday | Publication 15 (2026) |
| Next-day deposit | Required when $100,000 or more in taxes accumulates on any day in a deposit period | Publication 15 (2026) |
| Estimated income tax | April 15, June 15, September 15, and January 15 of the following year | IRC Section 6654(c) |
| Florida sales and use tax | Due on the 1st, late after the 20th of the month following the reporting period | Florida Department of Revenue |
Missing these dates is expensive in a way that compounds a cash problem rather than relieving it. Under IRC Section 6656 and the penalty schedule published in Circular E, the failure to deposit penalty runs at the rates below. Deferring a deposit to cover a shortfall is therefore one of the most costly forms of short term borrowing available to a business, and it is worth comparing against the cost of a line of credit before it is ever considered.
| Deposit lateness | Penalty rate |
|---|---|
| 1 to 5 days late | 2 percent |
| 6 to 15 days late | 5 percent |
| 16 or more days late, but before 10 days from the first IRS notice | 10 percent |
| Amounts that should have been deposited but were paid directly to the IRS or with the return | 10 percent |
| Amounts still unpaid more than 10 days after the first IRS notice or after notice and demand | 15 percent |
What Does a Completed 13 Week Cash Flow Forecast Look Like?
The finished product is a single running balance read against a floor. The illustration below is hypothetical and simplified, and it is included to show how the arithmetic behaves rather than to describe any particular business. Actual results depend entirely on the facts of a given company.
Assume a seasonal Southwest Florida services business with an opening bank balance of $74,000 and a minimum operating floor of $25,000. Payroll of $52,000 runs biweekly in the odd numbered weeks. As a semiweekly schedule depositor, its payroll tax deposit of $17,000 lands the week after each payroll. Rent of $12,500 falls in weeks 1, 5, 9, and 13. Operating disbursements run $15,000 per week. Debt service of $6,800 falls in weeks 2, 6, and 10. An insurance premium of $9,500 falls in week 5. Sales tax of $6,500 is remitted in weeks 3, 7, and 11, and a $34,000 estimated income tax installment falls in week 7. Collections decline through the middle of the horizon as the season ends.
| Week | Opening cash | Receipts | Disbursements | Net | Ending cash | Notable items |
|---|---|---|---|---|---|---|
| 1 | $74,000 | $68,000 | $79,500 | -$11,500 | $62,500 | Payroll, rent |
| 2 | $62,500 | $61,000 | $38,800 | $22,200 | $84,700 | Payroll tax deposit, debt service |
| 3 | $84,700 | $74,000 | $73,500 | $500 | $85,200 | Payroll, sales tax |
| 4 | $85,200 | $49,000 | $32,000 | $17,000 | $102,200 | Payroll tax deposit |
| 5 | $102,200 | $58,000 | $89,000 | -$31,000 | $71,200 | Payroll, rent, insurance |
| 6 | $71,200 | $42,000 | $38,800 | $3,200 | $74,400 | Payroll tax deposit, debt service |
| 7 | $74,400 | $51,000 | $107,500 | -$56,500 | $17,900 | Payroll, estimated tax, sales tax; below the floor |
| 8 | $17,900 | $33,000 | $32,000 | $1,000 | $18,900 | Payroll tax deposit; below the floor |
| 9 | $18,900 | $38,000 | $79,500 | -$41,500 | -$22,600 | Payroll, rent; cash goes negative |
| 10 | -$22,600 | $44,000 | $38,800 | $5,200 | -$17,400 | Payroll tax deposit, debt service |
| 11 | -$17,400 | $57,000 | $73,500 | -$16,500 | -$33,900 | Payroll, sales tax; lowest point |
| 12 | -$33,900 | $63,000 | $32,000 | $31,000 | -$2,900 | Payroll tax deposit |
| 13 | -$2,900 | $70,000 | $79,500 | -$9,500 | -$12,400 | Payroll, rent |
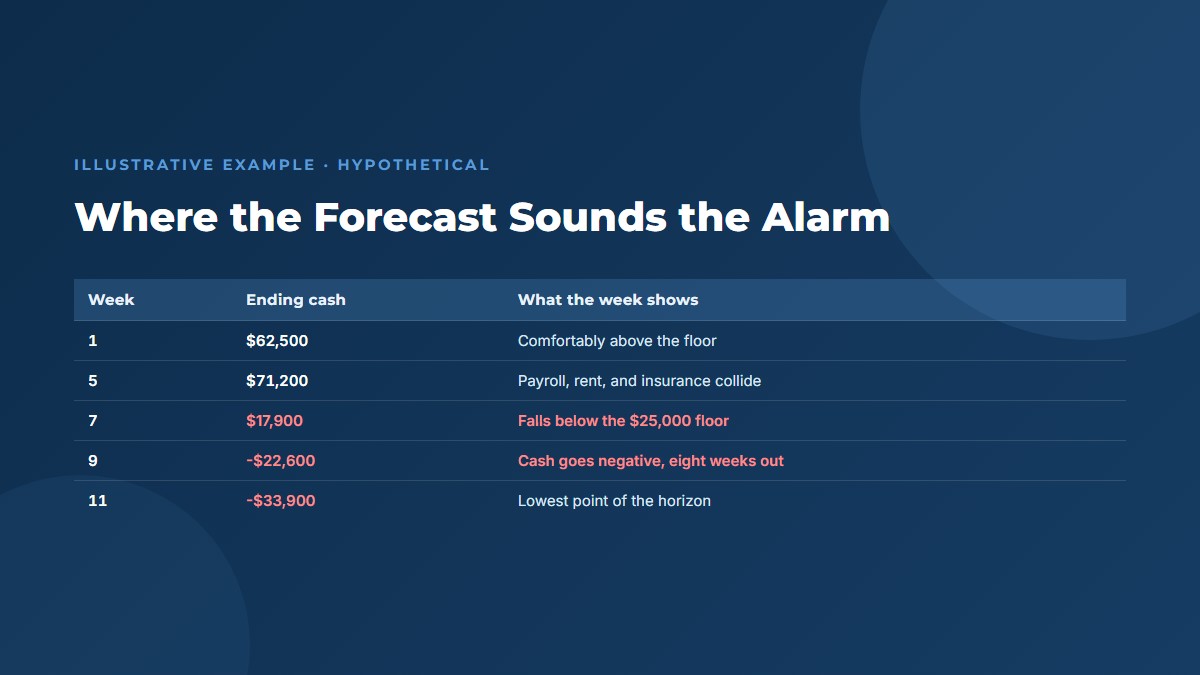
Read the ending cash column and the picture is unmistakable. The business is not in trouble in week 1. It crosses below its $25,000 floor in week 7, six weeks out, and it runs out of cash entirely in week 9, eight weeks out. Across the full horizon, receipts of $708,000 fall short of disbursements of $794,400 by $86,400.
Two details in this illustration deserve attention because they are the ones a generic template tends to get wrong. First, the week 7 collision is not caused by any single item. It is payroll, the sales tax remittance, and the estimated tax installment landing in the same week, and only a weekly view shows that collision at all. Second, the payroll tax deposit generated by the week 13 payroll does not appear anywhere in this table, because for a semiweekly depositor it falls in week 14. A forecast that ends cleanly at week 13 without noting that trailing obligation understates the true near term commitment by $17,000.
Which Levers Move Cash When the Forecast Shows a Gap?
Once a gap is visible, the available levers fall into four groups: accelerate receipts, defer discretionary disbursements, add financing, or reduce the underlying cost structure. The first two act within the forecast horizon. The third changes the shape of the balance without changing the operations. The fourth is the only one that fixes the problem permanently, and it is also the slowest.
Accelerating receipts generally produces the fastest movement, because most businesses carry more slack in collections than they expect. Concentrated follow-up on the largest past due invoices, deposits or progress billing on work in process, and a deliberate policy on payment terms all pull cash forward. What does not help is a broad discount offered indiscriminately, which converts margin into timing and usually costs more than the financing it replaced.
Deferring disbursements works within limits, and the limits matter. Discretionary purchases, capital projects, and owner distributions can generally be moved. Payroll, payroll tax deposits, and sales tax remittances cannot, and treating them as flexible is how a manageable cash gap becomes a trust fund problem carrying the penalty rates set out above. Vendor terms can often be renegotiated, but that is a conversation to have early and openly rather than by simply paying late.
Reducing the cost structure is where the forecast connects to the broader margin question. A recurring quarterly gap is not a cash problem at all. It is a profitability problem presenting as a cash problem, and no amount of collection effort will resolve it. That distinction is one of the more valuable things a finance professional brings to the conversation, and it is examined further in our guide to what a fractional CFO does month to month. Our guide to how to improve gross margin covers the levers that close that kind of gap.
When Does the Forecast Justify Drawing on a Line of Credit?
A line of credit is appropriate when the forecast shows a timing gap that closes within the horizon, and inappropriate when it shows a structural deficit that does not. If the running balance dips and then recovers on its own as receipts arrive, the line is bridging a timing mismatch, which is exactly its purpose. If the balance declines steadily with no recovery, borrowing postpones the reckoning and enlarges it.
The illustration above shows the harder version of this test. Cash recovers substantially from its week 11 low, but it does not return above zero within the horizon, which suggests something more than a timing mismatch. The correct response is to extend the analysis beyond 13 weeks before committing to a draw, and to test whether the seasonal recovery genuinely restores the balance or merely slows the decline.
Timing the draw is a separate decision from sizing it. Drawing early, while the forecast still shows comfortable coverage, generally preserves better terms than drawing at the point of need, when the same lender is looking at a weaker balance sheet. Presenting a lender with a documented 13 week forecast also tends to change the character of that conversation, because it demonstrates that the owner has quantified the need and knows when it reverses.
How Do You Keep the Forecast Honest Week to Week?
The forecast stays useful only if it is compared against what actually happened. Each week, the prior week’s forecast is set beside the actual bank activity and the variance is examined line by line. Persistent variance in one direction is a modeling error to be corrected, not noise to be tolerated, and the discipline of that comparison is what separates a forecast from a spreadsheet.
Collections variance is the line to watch first, since it is the least controllable input and the one most often modeled optimistically. A business that consistently collects 85 percent of what it forecast should adjust its assumptions rather than continue to be surprised. Over a quarter, that single correction usually improves forecast accuracy more than any other change.
The weekly cycle is straightforward: update the actual opening balance, record last week’s variances, refresh the receivables aging, roll the horizon forward one week, and re-test the running balance against the floor. The table below lists the triggers worth defining in advance, so that the response is decided before the pressure arrives rather than during it.
| Early warning trigger | What it usually indicates | Typical first response |
|---|---|---|
| Projected balance falls below the operating floor in any week | A timing collision, often payroll meeting a tax date | Identify the colliding items and move what is legally moveable |
| Collections variance below forecast for three consecutive weeks | Model is optimistic, or a specific customer is slipping | Re-base the collection assumptions from actual payment behavior |
| Days sales outstanding rising while revenue is flat | Receivables quality is deteriorating | Concentrated follow-up on the largest aged balances |
| The forecast requires deferring a payroll tax deposit | A serious liquidity problem, not a scheduling question | Treat as urgent; the penalty rates make this the costliest option available |
| The gap repeats every quarter | A margin or pricing problem, not a cash problem | Move the analysis to profitability and pricing |
The forecast also informs decisions that are usually treated as purely tax questions. The timing of an equipment purchase, for example, sits at the intersection of the cash forecast and the depreciation rules, and an acquisition that is attractive for tax purposes may still be wrong in a week when the balance is near the floor. Our guide to cost segregation studies covers the depreciation side of that decision, and broader coordination is discussed in our Naples tax planning overview and our tax planning services. Owners weighing the engagement model itself may find our comparison of fractional CFO cost against a full-time hire useful.
Cash Flow Forecasting Naples: Help in Southwest Florida
Seasonality makes this discipline particularly relevant in Southwest Florida. Businesses serving construction, hospitality, marine services, professional services, and property management here often earn a disproportionate share of annual revenue in a compressed season, then carry a fixed cost base through the quieter months. A 13 week cash flow forecast is the tool that makes that pattern visible in advance rather than in hindsight.
Tax Expert Today LLC works with owners on building the forecast, integrating the tax disbursement calendar correctly, and interpreting what the running balance is actually saying about the business. Our team includes tax advisors, enrolled agents, CPAs, and attorneys, which means the cash conversation and the tax conversation happen together rather than in separate rooms.
Our office is at 11983 Tamiami Trail N, Naples, Florida 34110. Call (239) 441-2005, Monday through Friday, 10:00am to 5:00pm ET. We serve clients in Naples, Bonita Springs, Estero, Fort Myers, Marco Island, and throughout Florida and all 50 states. Ongoing financial oversight is available through our fractional CFO services and our business consulting practice.
Does a seasonal business need a different forecast horizon? Not necessarily a different horizon, but it does need a longer companion view. A 13 week forecast run during the season will show healthy coverage and reveal nothing about the trough that follows. For a seasonal Southwest Florida business, the weekly forecast is most useful when it is read alongside a rolling twelve month view, so that the quarter in front of the owner is understood in the context of the full annual cycle.
When to Engage a Professional
The forecast is most valuable before it is urgent. An owner who builds one during a comfortable quarter learns the model while the stakes are low and has a working instrument when conditions change. An owner who builds one during a crisis is learning the tool and interpreting it under pressure at the same time, which is the least favorable circumstance for both.
Professional involvement tends to matter most in three places. The first is construction, particularly modeling collections from the receivables aging rather than the sales plan, which is the assumption that most often produces a forecast that looks reasonable and is wrong. The second is the tax disbursement calendar, where the deposit schedule, the estimated tax dates, and the state remittance calendar all have to be placed correctly. The third is interpretation, because the same declining balance calls for entirely different responses depending on whether it reflects a timing mismatch or a margin deficit.
Outcomes depend on the facts of each business, and nothing here is a promise about any particular result. What a disciplined forecast reliably provides is lead time, and lead time is what keeps the available options open.
Frequently Asked Questions
What is the difference between a 13 week cash flow forecast and a budget?
A budget projects revenue and expenses over a year on an accrual basis and measures performance. A 13 week cash flow forecast projects bank receipts and disbursements weekly over a quarter and measures liquidity. A business can be on budget and out of cash simultaneously, which is why the two documents answer different questions and neither substitutes for the other.
Why is the direct method used instead of the indirect method?
The direct method forecasts actual receipts and payments, while the indirect method starts from net income and adjusts for non-cash items. Over a weekly horizon the indirect method introduces accrual noise that obscures the timing detail the forecast exists to reveal. The direct method models the bank account, which is what the owner is actually managing.
How often should the forecast be updated?
Weekly. The rolling mechanic requires it: each closed week drops off the front, a new thirteenth week is added at the back, and actuals replace estimates for the week just ended. Updating monthly forfeits most of the value, because the timing collisions the tool is designed to expose develop and resolve within a matter of weeks.
Can a small business build this without dedicated software?
Yes. A spreadsheet is sufficient for most owner-operated businesses, and the structure matters far more than the tooling. The inputs that determine accuracy are the receivables aging, the payroll and tax calendar, and the fixed commitment schedule. Software helps with maintenance and consolidation across entities, but it does not improve a model built on optimistic collection assumptions.
What happens if a payroll tax deposit is missed to cover a shortfall?
The failure to deposit penalty under IRC Section 6656 applies at 2 percent for deposits 1 to 5 days late, 5 percent for 6 to 15 days, 10 percent for 16 or more days, and 15 percent for amounts still unpaid more than 10 days after the first IRS notice. Withheld employment taxes are held in trust, so this is among the most expensive and highest risk ways to bridge a gap.
Published July 31, 2026 by Dr. Pellumb Kabashi « Back to Learning Center
Have a question this article touches on?
Tax Expert Today LLC, based in Naples, Florida and serving clients across the United States.
Schedule a Consultation (239) 441-2005